Dimsky's Journal: 100 x 100

The 100 x 100 is a goal to trade $100 to $10K. Improbable but I think I can do it.

Brief Introduction
As stated in my introduction thread, I am a resident of Sri Lanka, where trading in Forex isn’t allowed, atleast with funds from within the country. It’s was a huge pain in the @$$ to get funds available in a broker account for live trading. Coordinated and set up a fund with Fusion Markets. Edit: Getting a 1:100 leverage.

Have a background playing a lot online poker, where I lost money being a bonehead. Took away a lot of lessons from that experience. I will return to poker one day and one day play a WSOP Main Event :grinning:

Methodology
I look at the 28 major pairs, am partial to traditional technical analysis and use indicators. I rely on the ADX, SMAs (10, 20, 50, 100, 200), Bollinger Bands (Std devs 1 & 2) and Stoch (5,3,3). I also apply apply a few PA ideas and read up on fundamentals where possible. My fundamentals are woefully lacking I feel because I don’t have a background in economics. So that’s where my recent focus has been.

I do a weekly analysis of pairs and place trades if the price actions tend to agree with the long term projected trends. I’m also aggressive and tend to put my money in correlating pairs, increasing my risk exposure upto 6% even. If I screw up, this will most likely be the reason.

Recent events and sked
My HDD crashed recently. That affected my studying routine and an MQL5 script I created in JUN. That script generated a csv dump that I uploaded onto a Notion workspace, as described here. I lost the script in the crash (didn’t backup) and my entire workflow was built around it. Luckily, my journal and historic data were online. I don’t code in MQL (learnt MQL5 just to code this script) so it might take me time to recreate it.

Will also do this in myfxbook and have everything ready by the New Year, if not sooner.

Goal
The immediate goal isn’t the money. Statistically (and realistically) I should fail. I’m more focused on the process and it’s improvement. The money will work itself out if the process and discipline are good.

There’s a lot of work to do in the form backtesting various strategies, grading my journals, basic portfolio stats & continued studying. Will use this journal to document the stuff I do.

6 Likes

I was skeptical when I read the first sentence but now that I’ve finished all of what you wrote, I love it and I’ll definitely be following along! Also your Notion post was so helpful - I did want to ask though if you’re using the free version still? I didn’t realize they charged! Kind of pricey too. :confused:

Noton is very close to monday.com, it is also free for personal use.

Totally. All the snapshots of the gradual changes are all on the free version. So far I’ve managed to find a way to make it work for me without paying. Honestly didn’t think it’d be that flexible but it’s become the backbone to my daily trading routine atm.

1 Like

Thanks Greg. This helps :smiley: I’m looking for an alternative that’ll help aggregate the table data. Microsoft announced a notion alternative, Loop, that’ll I’ll also look into.

Hi,
An inspiring post, and I am sorry to hear you have lost data to a hard disk crash. they are far more common than people like to believe. I am not trying to teach you how to suck eggs, but - some questions.

Have you been using a MAC or a PC? Did you at any time use cloud services for backup? Have you been to a local IT outlet and asked if they can attempt a data recovery from your crashed HDD or asked how much it would cost to find out? I am advised that about 50% of HDD crashes (the spinning type, not the solid state type) are due to power surges and may be repairable. This includes the spindle being stopped any where other than its rest position, and as a last resort, the HDD cover can be removed and the spindle returned to its rest position. Best to have an IT forensic specialist do this in a clean lab. A bit like heart surgery - you don’t want to do it yourself at the kitchen table - they are a bit sensitive to dirt in the air (understatement).

Did you ever share your code with any friends or acquaintances via e-mail? If so, you may want to ask them if they could retrieve the code file and send it back to you. Did you ever post it on a forum, or use anything like google or dropbox to back any work up?

I thought I would ask. Over the years (as an IT contractor) I have seen some spectacular recoveries. It is worth trying before throwing away the disk. A uni student may be willing to do that free of charge or for a small fee. Best of luck recovering.

2 Likes
  • PC. Backed up some critical files on Google Drive but not a proper disk image.
  • There is a facility I was told to approach, with an initial consultation fee of $20-$30 and additional fees for recovery. The fees don’t appear to be much but the time taken to recover the data will take me about as much time to rebuild the script. Less of a hassle to recreate it. Reckon it will be a slow start but it’ll be quick after a full day of working on it. It’ll start to come back like riding a bike.

I’m thankful it was just the code. My biggest concern were my passwords. I’d luckily created a backup of my passwords in APR (shortly after I created a new bank account and broker). Had a huge sigh of relief when I saw this backup. Stuff like my Anki flashcards (very important part of my daily study routine) & Notion journal were luckily online.

Nope. I’ve been very private about my trading progress for now. Never shared it. Thought I’d uploaded a copy of it in my study journal (Notion), which I hadn’t. I downloaded the gif file I’d uploaded earlier in that notion forum post to see if I can discern any part of the code. It contains a changelog of the steps I took to structure the code. Still helps.

My HDD was an old (7 years this month) 1TB Seagate OEM SSHD (hybrid SATA partition for the boot I think). It was on it’s way out. Had damaged sectors that was exacerbated by a Win Update that went awry in OCT. After a lot of attempts at fixing it (CHKDSK & Rebuild BCD) I tried reinstalling Windows. Figured even with bad sectors I had approx 45% unutilized space that I’d be able to use to recover and build a disk image on an offline drive atleast.

I had the option of backing up the data with the assistance of a comp repair guy in my neighbourhood that had a dock for laptop drives. While using system restore before a Windows reinstall I’d left my room to get some tea to hear a loud crash. Dog had gotten tangled in the wire while playing with something. So there was a physical shock to a deteriorating drive while writing and a loss of power. Funny now but I was livid at the time. Can’t blame the dog if I didn’t take the precautions to back up my own drive when I had the chance with the dock. So that’s all on my stupidity.

I kept the HDD with me because it has some documents and images that I might need in the future. I decided I will recover the data when I need it.

1 Like

The loss of the script is perhaps a blessing in disguise. Sat down to re-write it and it brought back memories about how disconnected I felt going about trading that specific way. It was a success (could objectively be an inflated opinion because I’ve yet to run any numbers on those trades) but I didn’t feel like I was intimate enough with the underlying price action.

Then again it can be argued that it’s not the method but that I didn’t put in the backtesting required for it, which I am also guilty of. I’m going to have to address these underlying insecurities and questions before I reinvest into the previous approach or maybe even devise a completely new one.

In March I’d decided the $100 approach. Excerpt from my Learning Progress Journal:

Objective still remains somewhat the same though:

  1. Lock into a high probability trend
  2. Scale into it aggressively
  3. Trailing ATR Stop-Loss to take out all the trades at the same time

I’ve defined my ideal trade scenario. The question now is how realistic/practical is this approach?

Decided to note of all 100+ pip moves on the D1 charts for the Majors (28 pairs is unrealistic for now) and make observations for as many data points as I can. Period is a 12 month duration from 01DEC20 - 30NOV21.

The idea is to find common denominators in these observations and then use that as backtesting criteria to determine a success rate for those trades. For e.g. it’s observed that the following criteria are met for most uptrends:

  • ADX on incline and >15
  • Price > SMA10
  • Price > Bollinger Std Dev 1

The goal then is to determining the success rate when all three criteria are met. It’s possible that while 80% of uptrends meet this criteria that when all three criteria are met ideal uptrends actually occur only 25% (random %) of the time. Even if success rate is low are they still profitable overall? Breakeven at 25% should technically average an RR of 1:4.

Observations done for EURUSD only for now cause I’m finding it a time consuming.

Good baseline to not only determine common denominators but good place to log new indicators, if I chose to use them, or more realistically log new parameters for the existing ones (changes from SMAs to EMAs perhaps or Stoch from 5,3,3 to 12,3,3). Which is why I’ve noted the parameters and field headers as metadata.

Basically going in with the realization that I know nothing.

The approach, however, is still incomplete. I’m not looking at multiple time frames in detail and focusing only on D1. What if the ADX is trending on the W1 charts, wouldn’t that take a precedence over the D1? It’s a valid argument that this doesn’t address yet.

Caveats for 100 pip logs

The 100 pips are noted on D1 charts. For e.g. if there are 3 consecutive bullish candles the formula is simply: Close (Candle 3) - Open (Candle 1). When you make observations on the 4H chart, however, you tend to find a larger move. Two observed scenarios as folls:

An example of a trend starting in the latter part of the previous day and ending past the end date on the D1 chart

Trend on the D1 that had a lot of intraday volatility for a short period of time. Making a possible exit and re-entry possible.

211218_Significant trends_Major CP.xlsx (22.0 KB)

2 Likes

This is gonna be a good thread!

image

1 Like

Added a few fields, revisited EURUSD observations to populate data and did USDJPY. Failed to mention previously that 100 pip observations are on a minimum 2 candle range. 100 pip + daily spikes are ignored.

Also obvious oversight on the trading TF. With this account size I cannot trade above H1 where my default is to open with an SL of either 15 pips or 1xATR (higher of 2) and then trail 1.5-2xATR after moving to BE. The D1 observations are still relevant since I’ll be switching to a triple screen of D1 / H4 / H1 now instead.

It’s time consuming but needed. I’ve never looked at charts as closely as I do now and this approach helps. It’s suits the way I look at things. Might discard it over time with greater experience when things start to feel more intuitive but I doubt it.

Also wasn’t entirely happy that I was only dedicating so much time against D1 only. But then I realized I’ll be going over H4 & H1 with a fine tooth comb when I back test it against the predetermined criteria from this exercise.

PS - Happy New Year to anyone catching this! :partying_face:

211218_Significant trends_Major CP.xlsx (31.7 KB)

1 Like

Caught it…and wishing you a very Happy and Rewarding New Year 2022! :+1:

2 Likes

Wish you the same!! :partying_face:

1 Like

Happy New Year @darthdimsky.
Good information & journaling.
But who uses indicators now than only PA? Bars/Candles are footprints of trades.
Money is somewhere else, that people will not tell you & difficult to catch tho. Happy Analysis & Learning.

1 Like

@petrogold - Thanks for the well wishes. While I’ve gotten used to looking at charts the past year I’ve always felt comfortable looking at data on spreadsheets. Indicators, to me, quantify PA in numerical terms. I don’t shy away from using PA. I just don’t rely on it solely. Tend to use it as a further confirmation for entries/exits.

Journal
Decided to take a break from staring at the D1 charts and attempted to code something in MQL5 (incomplete). Also thought I’d look at the H1 data for all the US pairs to get a better idea about the hourly activity because I’ve never really paid heed to the TYO session. Only spent time on the LON and NYC sessions. Wanted to know if I was being an idiot.

Charts show an average change in pip values and tick volumes for Calendar Year 2021 by hour. Times are in GMT+2 (MQL5), which translates to the following session times:

  • TYO = 0100 - 1200
  • LON = 0900 - 1800
  • NYC = 1400 - 2200

Notes:

1. Tick volume is according to liquidity provider against my broker. May not be an accurate representation of tick data for all LPs out there.
2. DST isn’t taken into account. I’ve never lived with DST and calculating it confuses me & gives me headaches. So there might be a +1hr skew for a portion of the data.
3. Certain months traditionally have had more activity than others so there could be greater deviations in certain months.

Overall tick volume gives a more accurate picture than hourly change to tick vol. It also shows a strong correlation b/w tick volume and hourly change in pips. Following charts I found are less confusing.

Man, sad to hear about Betty White passing away. RIP :cry:

GBPUSD done. AUDUSD next. Without quantifying anything concretely and with just looking at D1 charts I’m able to determine:

  1. The SMA is a great entry indicator. This isn’t surprising with a lot of forum articles and TA/PA books giving a preference for EMAs (EMA20 in particular). Am finding that lower D1 volatility around (50-60 pips) tend to conform to SMA10 while higher volatility (80-100 pips) tend to conform to SMA20.
  2. A Bollinger band exit on the Std Dev 1 can be a reliable exit indicator. With pairs of lower volatility just following this blindly will lead to premature exits because bands have a higher constriction and you risk being whipsawed out of a trend. Perhaps a first exit after a relevant countertrend candle?
  3. Preliminary looks on the ADX on the W1/D1 TF are inconclusive. Perhaps there will be more consistency in the lower TFs. Also wondering if I’m looking at the ADX all wrong. I’ll know soon.

Had also noticed spread data in the initial data export. Determined it was largely unreliable since 69% of the data for the 7 USD pairs consisted of a zero spread.

My broker has a zero spread accounts and perhaps the data is accurate for those accounts. Not relevant for my Standard account though, which is also where the export data is from.

Also used the data to determine whether TYO or LON sessions could be used as a leading indicator for the the movement of price for the following sessions. It was inconclusive. Still suspect there could be a correlation b/w LON & NYC sessions, which I’ll look at later.

211218_Significant trends_Major CP.xlsx (42.5 KB)

Was re-reading portions of Ashraf Laidi’s book because I couldn’t apply anything in there during the time my laptop was out of commission.

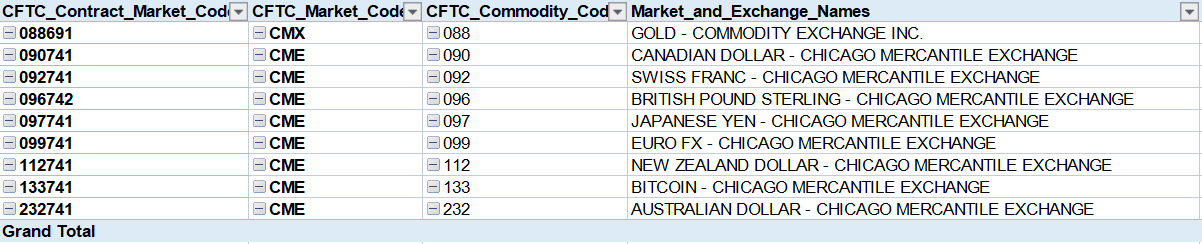
While going through the first chapter on Gold I remembered watching a real vision finance interview with Tony Greer that discussed BTC and it’s possible risk off traits. I wanted to know if there were any numbers that justified it. The only place I thought of looking were maybe COT reports. I don’t know futures and didn’t know if there was a BTC future. Luckily found this that indicated it’s availability.

Downloaded a few of the variations of the reports and figured out which one the Insider Week website was sourcing it’s data from (“Futures Only” here), how the numbers were derived and why they were derived that way.

It’s a steep learning curve for someone with no knowledge of futures. But satisfying to understand, ateast the parts I wanted to know. Some data for future reference if I have to trawl through the data again:

Decided to look at the correlation for the entire 2 year period and it’s inconclusive. Just a cursory glance indicates no relationship/weak relationships between Gold and other instruments

Looking at 2 years worth of data doesn’t tell me whether there were changes to the the relationship mid way. Meaning there’s a possibility that there were periods of strong correlationship between XAU and the other instruments.

Implemented a rolling 12-week correlation to to gold. No real significance to the 12 week duration. The books outlines a 6 month rolling correlation but for a 7-8 year span. It showed times when BTC and Gold were strongly correlated, FEB-APR & again in JUN-JUL

The rest of the correlations to the AUD & JPY didn’t make a lot of sense. Especially the positive & negative correlations, respectively, in the first half of the year. That made no sense.

The exercise was meant to determine whether BTC is a risk off assett but I was only considering Gold as the only risk off indicator so far. That wouldn’t make sense if some of the capital/contracts that would traditionally have gone to Gold are now taken up by BTC instead. This is evident if you standardise the open interest for XAU & BTC (07JAN20 = 100) and plot them side by side.

What the chart clearly shows is that BTC contracts, at the end of 2021, are at ~231%, compared to the open interest figure on 07JAN20, while XAU contracts in comparison are ~65% of the corresponding volume

For a more meaningful correlation it’d make more sense to look at the aggregated open interest for BTC & XAU, which if considered for the entire 2 year period would look like:

When looking at overall numbers the near zero correlation with the strongest risk off currency and a positive correlation of 0.92 with a currency that has the most hawkish central bank makes no sense. The rolling 12 week exercise was applied again after applying correlations to the aggregated XAU/JPY open interest with more encouraging behavior.

Number of takeaways from the graph:

  • The NZD & AUD show a strong correlation to each other, atleast in the first 3Q of the year. That’s consistency is encouraging.
  • Why do the risk on currencies have a positive correlation to risk off assets (not just the aggregated XAU/BTC but also the JPY)? Were the AUD/NZD that weak in the periods MAR - early MAY and late JUN - SEP?
  • The risk on currencies show the same dip to no relation that Gold showed to BTC for the same time period, between MAY & JUN
  • While the NZD is more inconclusive toward the end of the year, its encouraging to see the strong positive correlation against the JPY and the strong negative correlation against the AUD at year end, which gives credence to the theory of BTC of being a strong risk off asset.

Some of the anomalies can be explained as folls:

  • The dip to no correlation of XAU to BTC and later XAU+BTC to NZD & AUD - The timeline is significant. This is when all hell broke loose with BTC after the ransomware attack on the colonial pipeline on 07MAY. That began a cascade of events, like the US government’s crackdown on BTC, Musk’s announcement to stop accepting BTC payments for TSLA & China’s eventual ban on cryptocurrency mining. Further confirmed by the sudden dip in daily hashrates for BTC in MAY.

source - Bitcoin Hashrate Chart

  • The NZD’s non correlative behavior in Q4 - Does this coincide with the drastic coronavirus lockdowns that began with the discovery of it’s first cononavirus case since FEB? I remember that’s when we were expecting the RBNZ to increase it’s interest rates. The first Central Bank at the time. Though I’m keen to pin the lack of correlation to the unexpected market environment caused by the drastic measures taken for the coronavirus lockdown I’m a bit hesitant to say that’s the certain cause without more data points for validation.

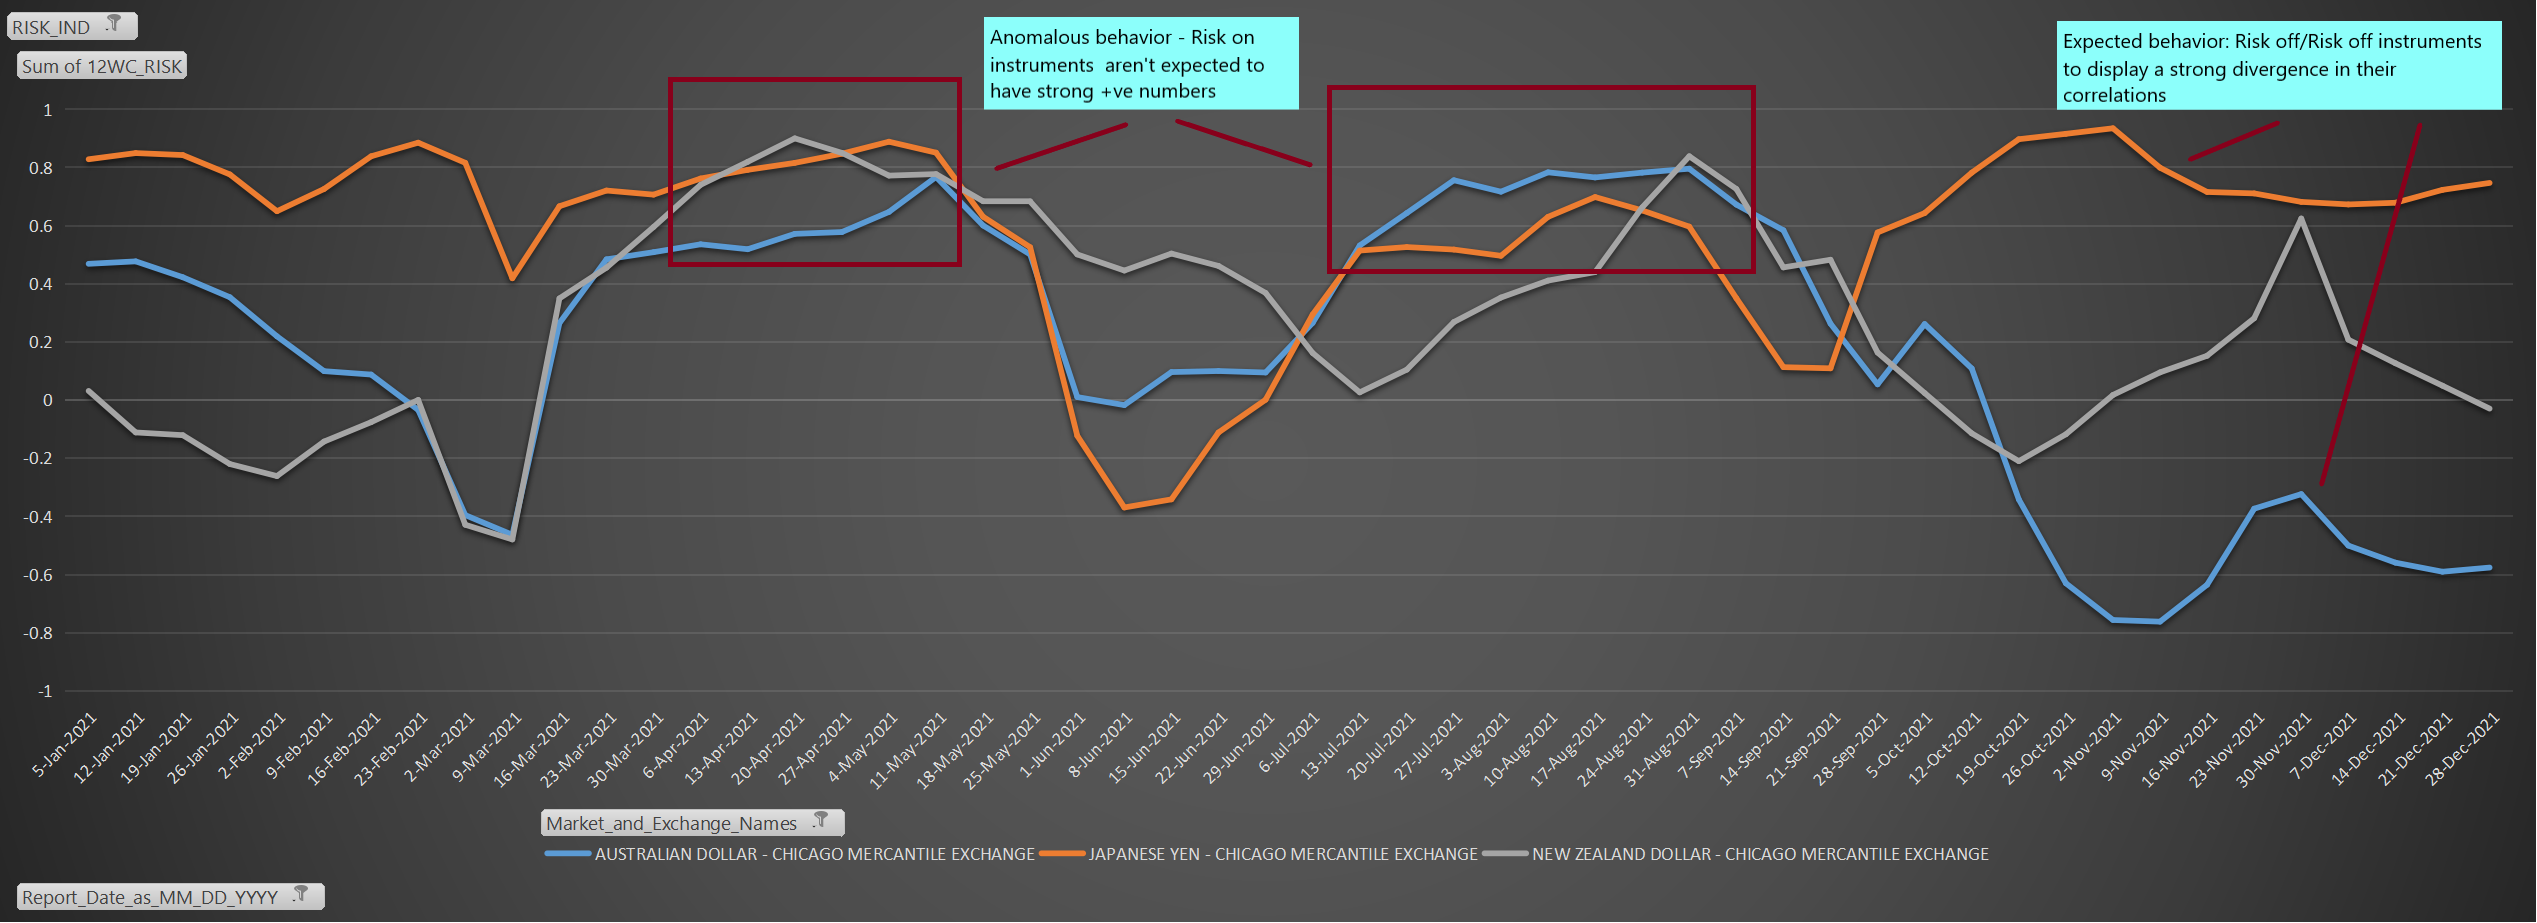
  • The positive correlation between AUD/NZD (Risk on) and XAU+JPY (Risk off) Open Interest for MAR-MAY & again from JUL-SEP is a huge cause for concern. That’s just not supposed to happen, atleast not to the best of my limited knowledge. Recap of that behavior on the same chart with remarks:

Decided the best way was to determine the validity of the behavior was to apply the same correlation to the indices for the same currency pairs. In the absence of an instruments like the DXY equivalent (atleast not that I’m aware of atm) for the USD. I decided to use the TWI or the EER equivalents. Thankfully there’s a centralized repository for the EERs at the BIS here. The only issue is that this might be real when I’d thought till date that nominal effective exchange rates was the way to go.

Is there a positive correlation between the JPY and AUD/NZD in the effective exchange rates?

Unlike other correlations I decided anything > -0.4 is significant. Simply because we expect risk on/risk off instruments to mirror. This period overlaps with the anomalous zones determined by the opened interest positions in the COT data, which, for now atleast, doesn’t invalidate the approach I took. But to even see a correlation > 0.4 between the JPY and AUD/NZD at some points is really surprising and cool. Didn’t expect that.

Conclusions/Takeaways:

  1. At present BTC & Gold is used as part of portfolios for Risk off behavior and the COT data can quantify that.
  2. Applying a rolling correlation can give a lot of insight into an instrument’s behavior in light of changing market conditions. Credit for this idea in this instance is with Mr Laidi in his book where he demonstrated it:
    Ashraf Laidi snippet
  3. Risk on instruments can at times have positive correlations with risk off instruments! :face_with_raised_eyebrow:
1 Like

On another note - Came across this fascinating study done by the CFTC about BTC trader profiles here:

The most interesting bit was the fat tailed distributions, where a majority of traders had BTC as <20% or >80% of their total portfolio. Some very interesting observations there.

CFTC BTC participants

100 pip+ D1 trend analysis

AUDUSD done. This was a very tiring exercise. I hated it. I hate manually plotting and gathering data points. I procrastinated over 2-3 days because I hated it so much. Pain in the frickin @$$. This is why I learnt MT5 for that csv in JUN. This exercise has only motivated me to go back to it and complete it. I will take a break from the H4/H1 analysis and compile that code again.

211218_Significant trends_Major CP.xlsx (50.1 KB)

D1/H4 insights

Downloaded H4 & D1 broker data and decided to run some numbers with the H1 data I had earlier. I wanted to know how the lower TF moves with the overall move for the day. For e.g. if the D1 was bearish how many of the lower TF candles proved to bearish on average over the year. One of the reasons was to determine if prior sessions could be used as leading indicators for PA.

Another reason was the boredom from the 100 pip trend analysis. I used the prospect of crunching these numbers as a carrot stick to get myself to finish that exercise quickly.


Takeaways

  • No surprise that that the LON and NYC sessions generally more or less determine how the CPs on average move for the session.
  • What would make it more relevant is if a combination of H4 candles in the same direction generally coincide the overall direction for the D1 candle. For e.g. it’s found that when 60% of the 0000 & 0800 candles are bearish when the D1 candle is also bearish. This is possible. Might look at it later.

Overall doesn’t appear to be a huge surprise. Each of the respective currencies are the busiest at their respective sessions. Perhaps it could do with an average tick volume overlay to give more meaning?

D1/H1 insights

Identical exercise with D1/H1 instead.

Takeaways

  • EURUSD: ~58.5% of 0000hr candles tend to go in the direction of the D1 candle. In raw % terms that could be statistically significant.
  • USDCAD: ~57% during the TYO session @ 0200. Also remarkably is an inverse relationship with the 0100 candle that indicates that 55% of the time this candle indicates the opposite direction of the D1 candle.
  • USDCHF: ~58% & 55% of 0000 & 0100 movements respectively coincide with overall D1 movement. This could be a significant indicator of risk-on/risk-off behavior by the big JP players.

The USDCHF chart raised more questions. Would adding tick volume give more context? Previous numbers already show a strong correlation between pip movement and tick volume.


Avg tick volume registered is ~24% more (at ~714) for 0000hrs when H1/D1 candle directions match. Great stuff. Bit tired atm to do the rest of the charts but EURUSD was also really interesting


Tick volumes @ 0900/1000/1100 register an increase of ~500(15.4%)/~350(8%)/~400(10.6%) respectively. Possibly a significant leading indicator heading onto the NYC session. Exciting stuff!

Fundamental data

FXStreet’s economic calendar has an option to download as csv. I was super excited to find this till I looked at the raw data.

No figures. none. zilch. So disappointing. Atleast it enables some insight:

FXStreet_AUD High

Felt a strong burning desire to dump everything and learn Python for online data scraping when I saw this initially. Thankfully I had already found out it might be possible on MQL5 back in JUN, so that’s another incentive to go back to coding in MQL5. I will do my best to avoid manual data collection for key fundamental data.

Psychology

Huge gaping issue atm. I have pored over technical books, read up on statistics, economics & fundamentals. But next to nothing on psychology. This is despite knowing how weak my mental disposition was when I was playing poker. Though most of the lessons I learnt then, I feel, are ingrained in my DNA now, I also know it’s still lacking. It’s a muscle I stopped working on a long time ago. That was a mistake.

Going to devote a majority of my time to developing the MQL script, followed by psychology. Will work in parallel with the H1/H4 analysis as a 2nd priority.

1 Like