Disney (DIS) has had a tremendous rally since the all-time lows which ended at the Peak early last year. The stock peaked at $202.73 and has dropped more than $100.00. The Elliott Wave Theory states that there is always a correction to happen in three, seven, and eleven after five waves advance. Disney advance since the all-time is a classic five waves advance, as the following chart shows:
Disney Quarterly Elliott Wave Chart
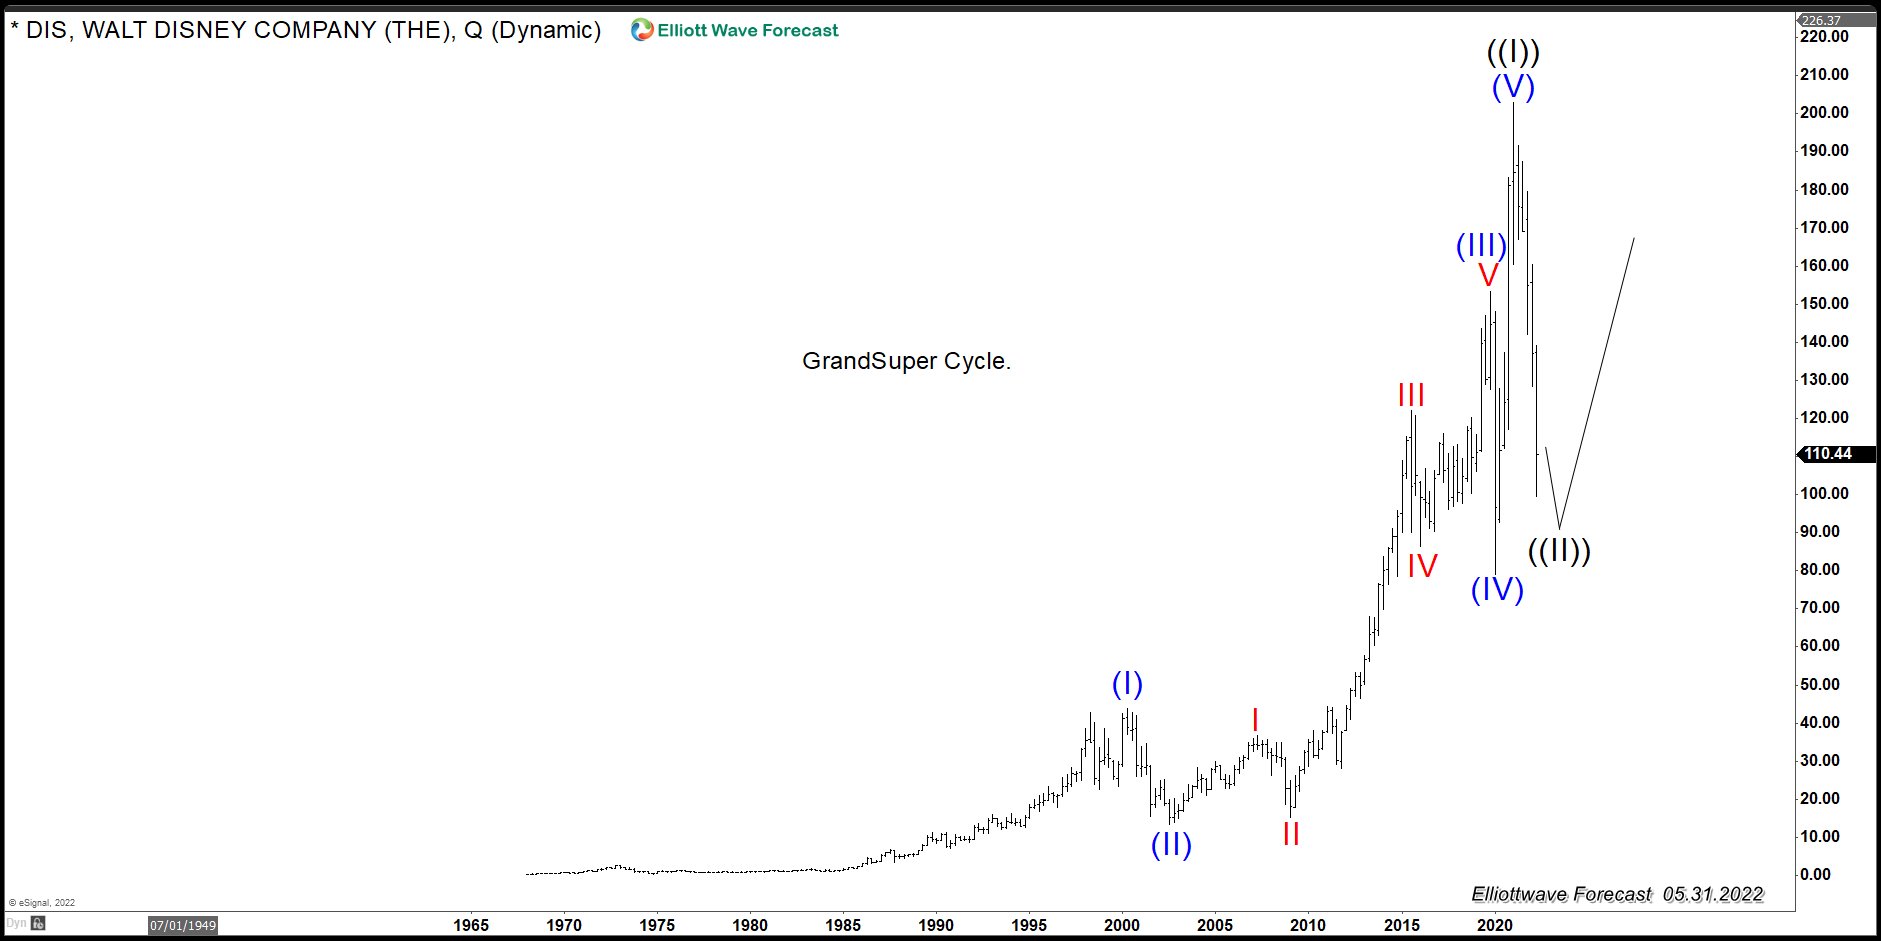
The advance comes in two majors degree, wave (I) in blue or Super Cycle degree and wave I in red or Cycle degree. The Peak created a Grand Super Cycle, which we labeled at ((I)). The stock now should be trading in wave ((II)), which might represent a tremendous buying opportunity.
Elliott Wave Impulse Chart
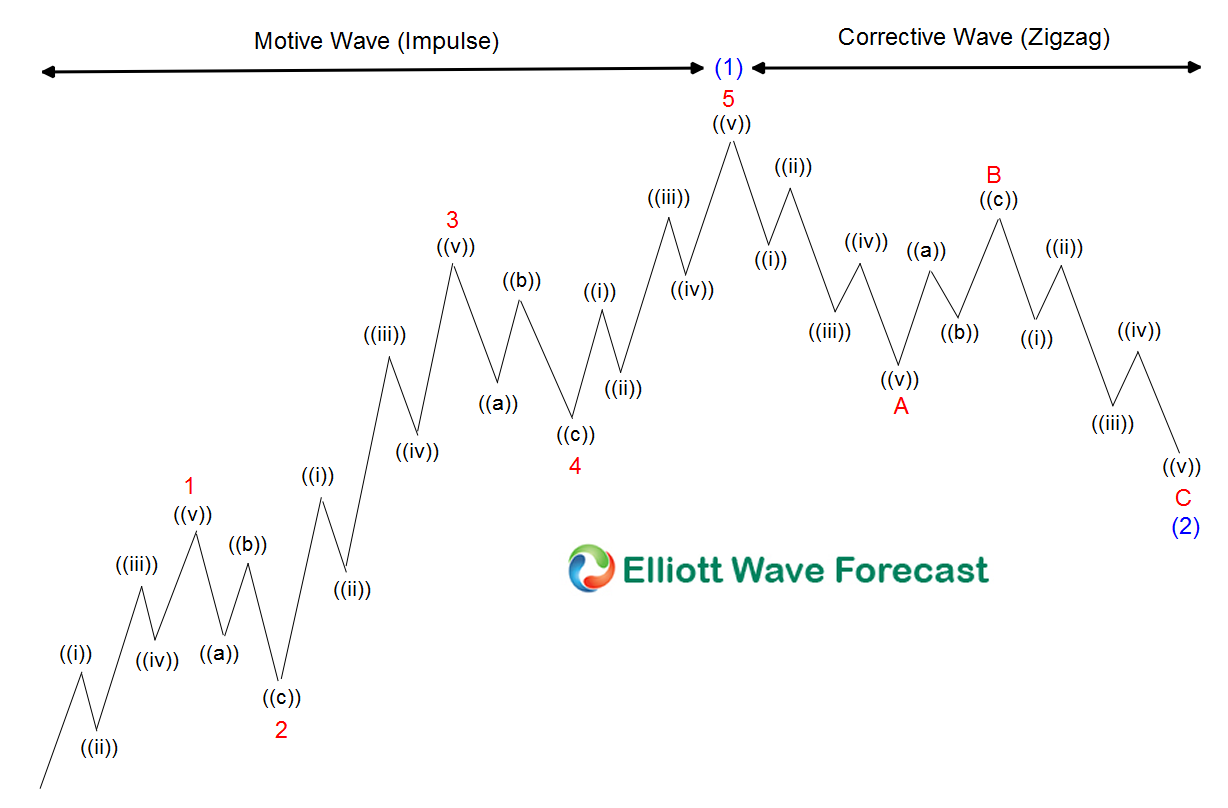
The Elliott Wave Theory was developed back in the 1930s. The world however has developed a lot over the last century with the advance of computers. The classic Elliott Wave Pattern is identical to Disney’s Grand Super Cycle chart. As the pattern above shows, after five waves advance, a correction happens before the previous trend renews. We at EWF notice how the High-Frequency Trading Machines (HFT) has taken over trading. We have identified the sequences, either as impulse or corrective, in which they trade.
It is interesting to see the HFT buying and selling in every single time frame and how there is always money flowing in and out of the market. There is a lot of credit to the Theory’s observations. But without adjustments in 2022, we might be lost at this moment applying the original Theory. We have added the blue boxes to present members with the areas where the HFT machines are entering the market.
We have incorporated the sequences of 5-9-13-17-21-25 (Impulse sequence ) to identify the right side or trend. The counter-trend corrective sequence runs in 3-7-11-15-19-23. We have added a distribution system to locate the cycles. When the connectors in correction are completed, we can get the right measures to enter the Market. These tools were not available back in the 1930s. But as we always said, the cars we drive today are much better and faster than then one a century ago, even when the concept is the same.
Disney has been correcting in a simple ABC since the Peak at 03.08.2021, a structure with a sequence of 5-3-5. It should end around the 100% extension between the A and B to provide the equal leg or 100% distance to travel when C=A.
Elliott Wave Zigzag Chart
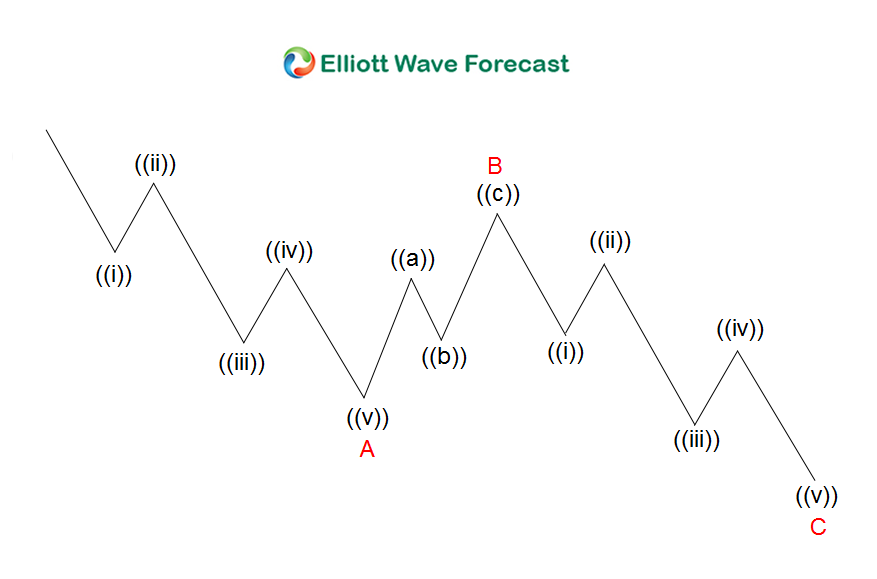
The pattern above is a representation of an ABC. We can see how the subdivision of each leg comes in five waves. The classic Elliott Wave Pattern presents ABC as a move against the main trend. After the correction ends, the trend will renew, providing traders with a unique opportunity.
Disney Weekly Elliott Wave Chart

The decline since the Peak at 03.08.2022 shows the ABC pattern in Disney. It prsents a very technical decline with a very nice defined buying area. The blue box area is where the HFT Machines will be entering the Market. This is the area when we recommend our members to buy the stock. The 61.8-76.47 Fibonacci extension area at $101.27 - $112.02 is also an HFT area. Sometimes the market truncates in the area without reaching the blue box, which is why we also highlight the area in our charts.
The Theory will provide trade opportunity based on the corrective sequences to either trade into new highs, or bounce in three waves, and then turn lower in seven swing into another buy. As always, trading is about knowing the market nature and understanding when and where to enter the Market. The Originals Theory helps, but we add all the tools to make it better.
Source: DIS (Walt Disney Company): A Grand Super Cycle Opportunity