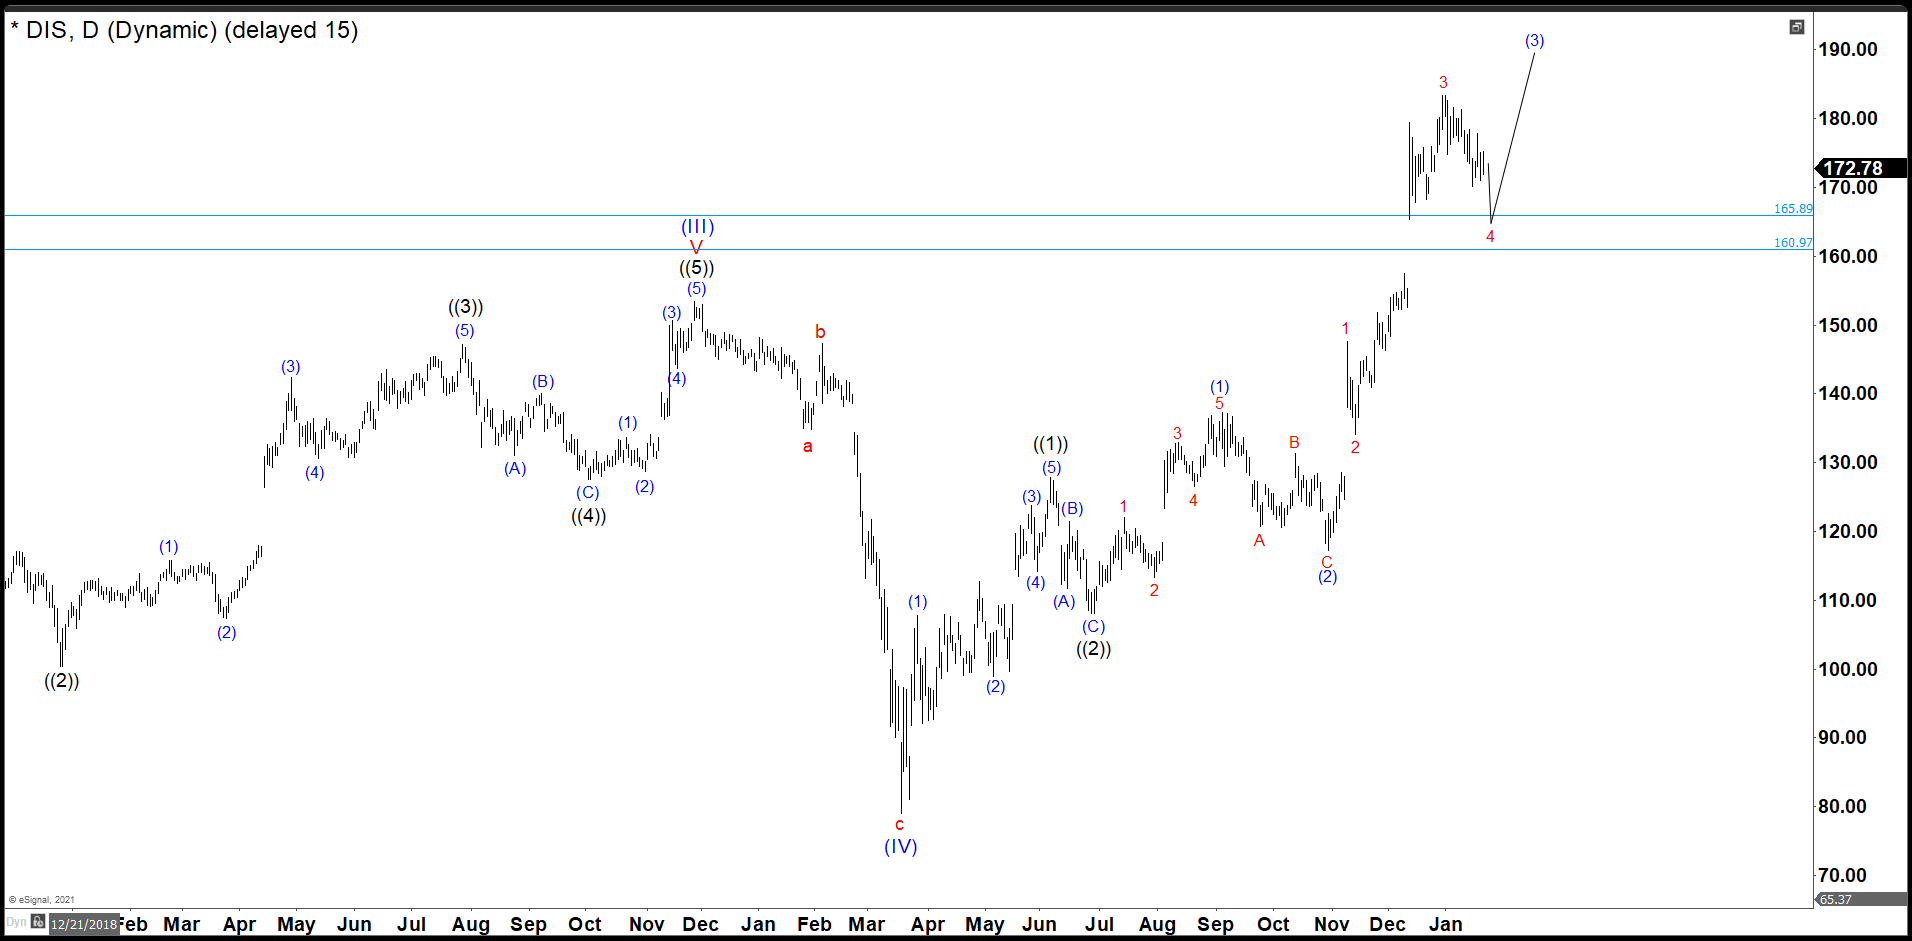
Since the crash of March 2020, all stocks have tried to recover what they lost and Disney was no exception. Disney did not only recover the lost, but It also reached historic highs. Now, we are going to try to build an impulse from the March 2020 lows with a target around $230. Target measured from 0 to 2019’s high projected from March’s low, equal legs.
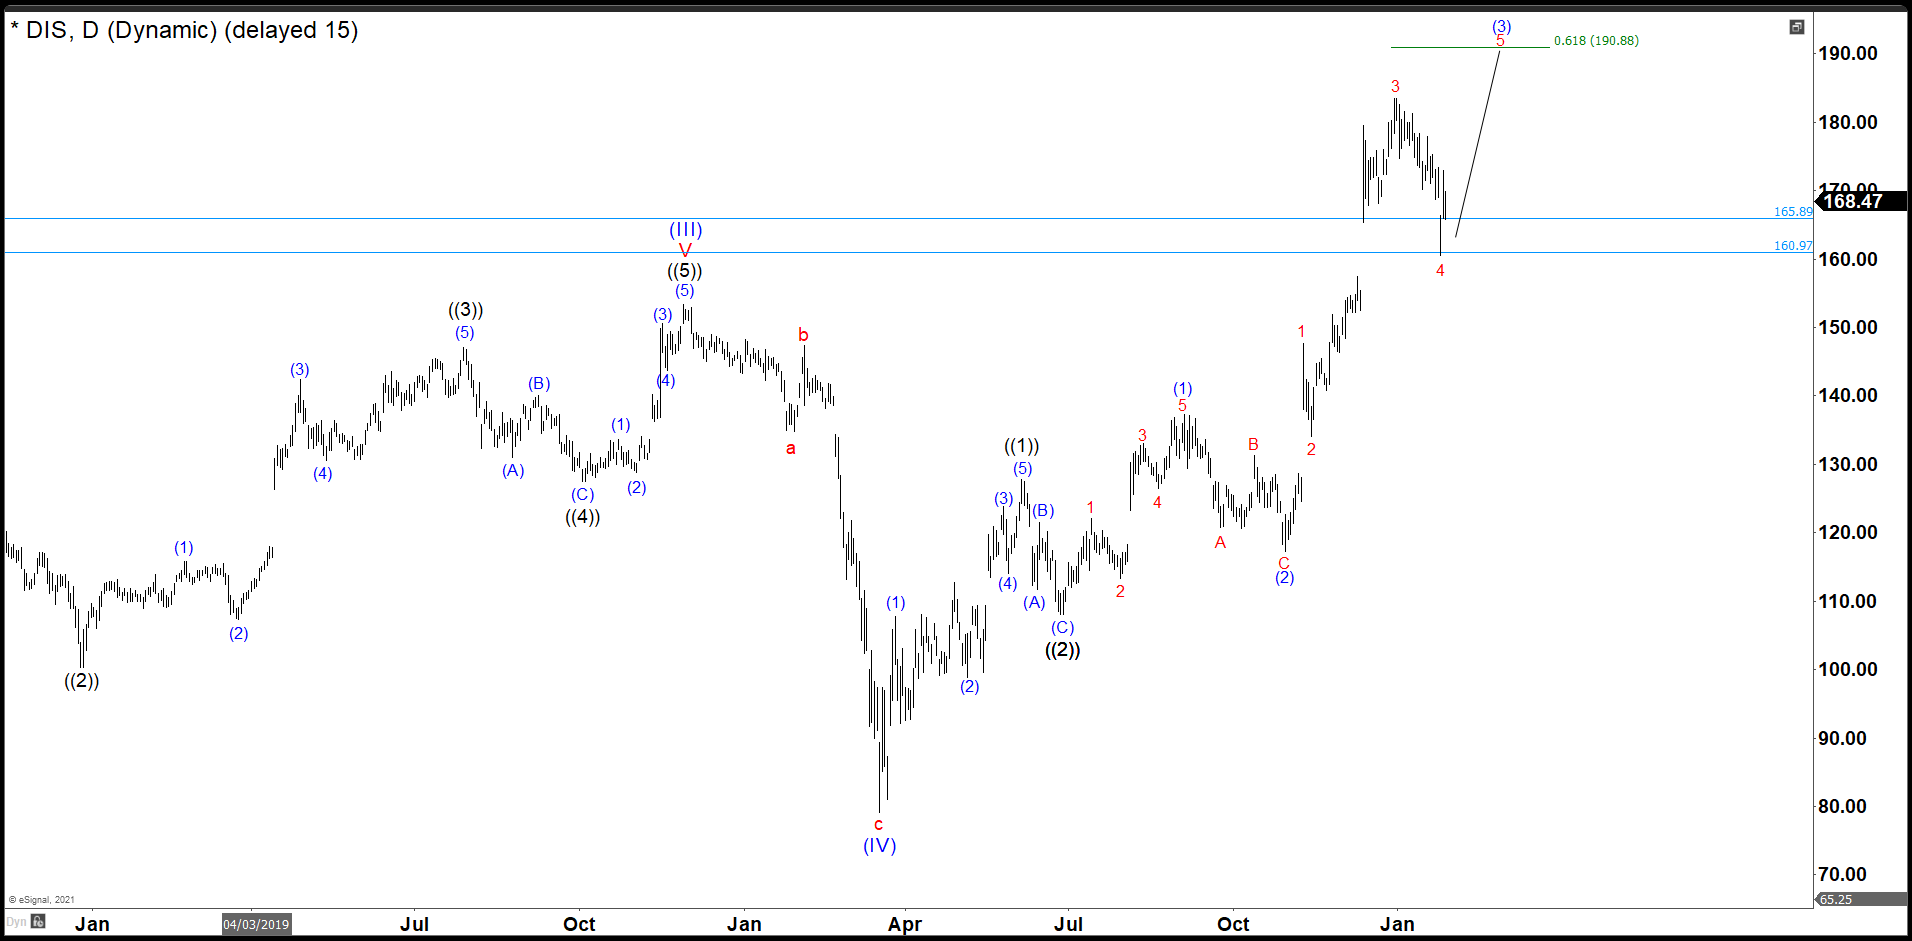
Disney Daily Chart
Last week we expected to complete a wave 4 in the 160.97 – 165.89 and then continue higher to complete the structure of the wave (3). On Monday the market opened strong lower and at the end of the week we believe 158.95 was the end of the wave 4.
As we see in the daily chart, the waves ((1)) and ((2)) of the impulse have completed and currently we are building the wave ((3)). We believe that wave (3) of ((3)) is still developing and we need one more high to complete an impulse 1, 2, 3, 4, 5 in red. We expect that the wave 5 in red reaches 190.88, ideally, to end the structure of wave (3) of ((3)).
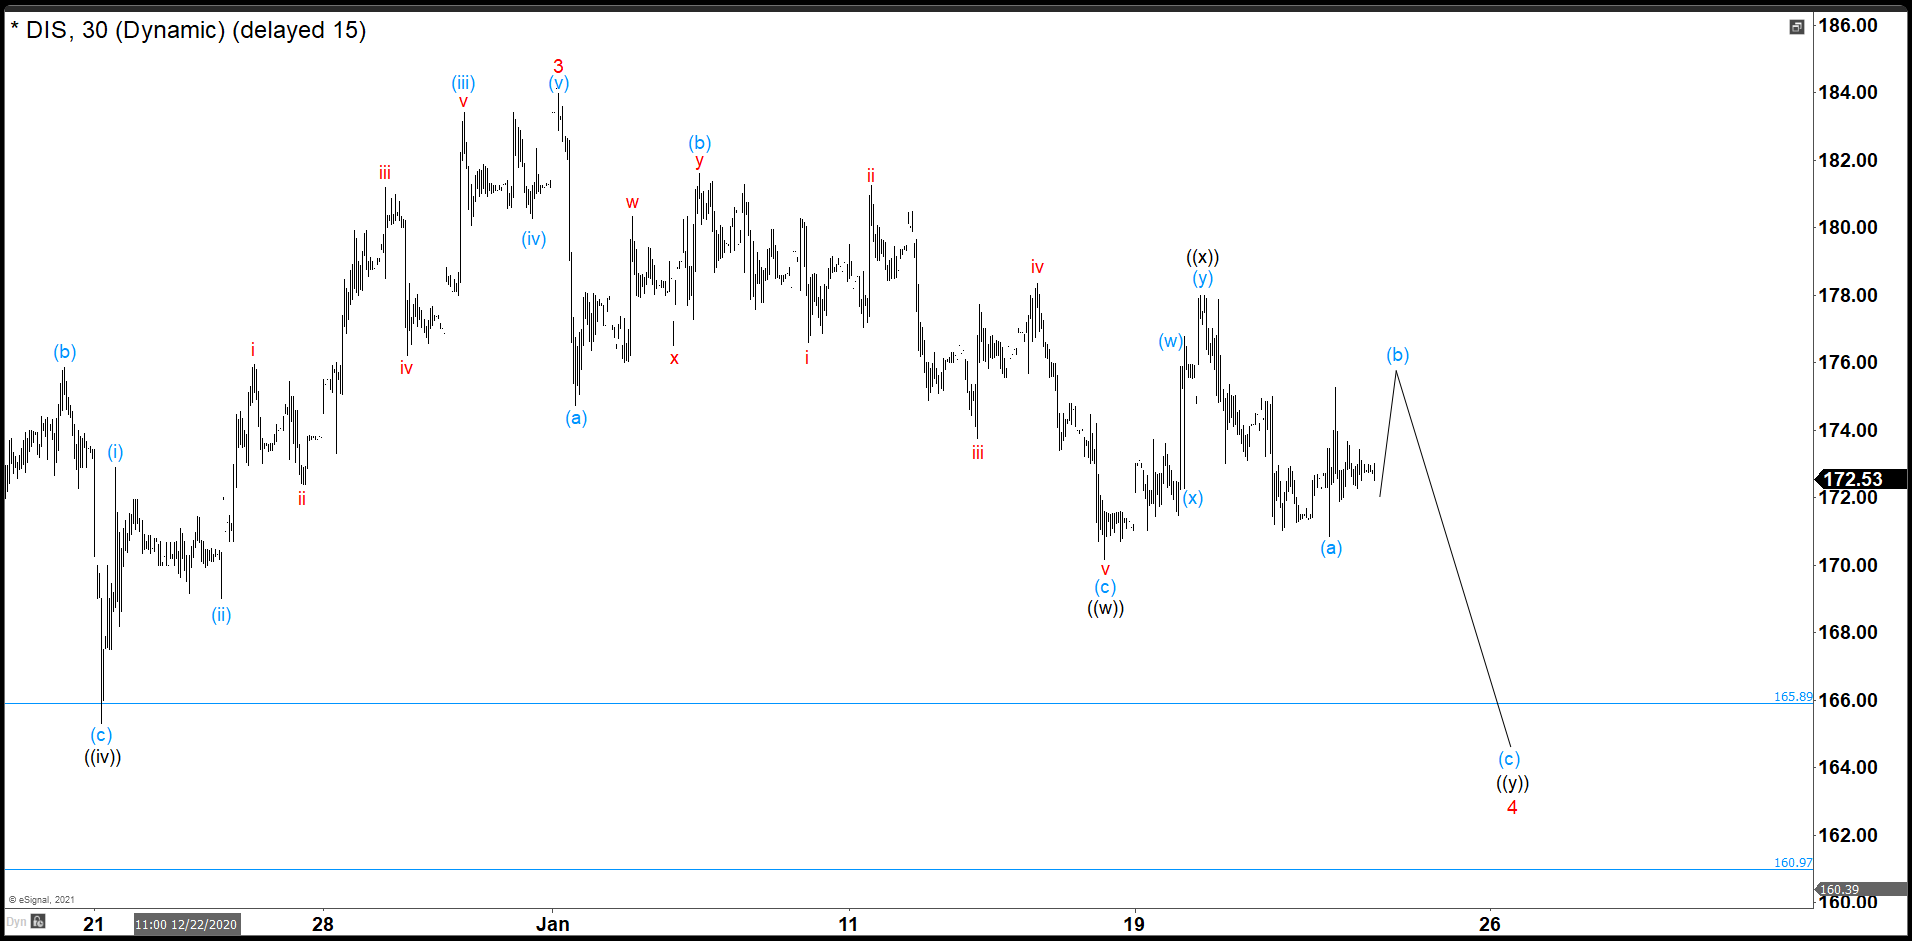
Disney 30 minutes Chart
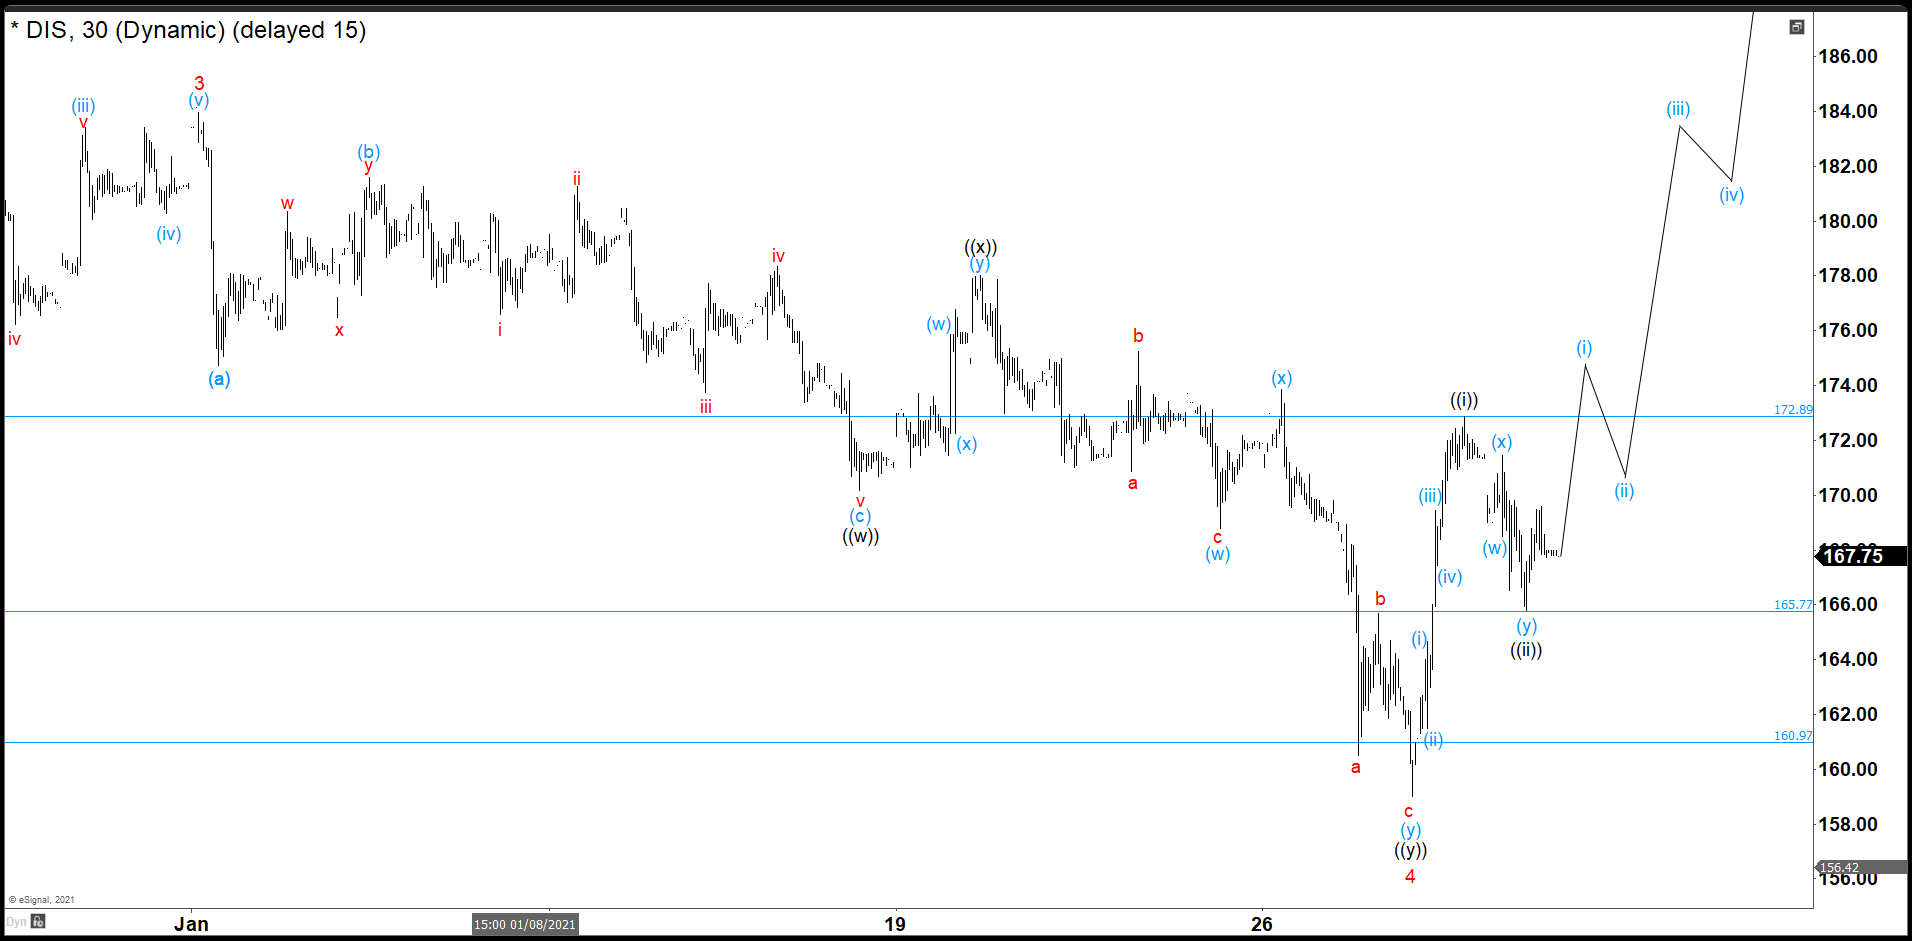
In this chart wave 4 of (3) finished. Disney built 3 waves to the downside ((w)), ((x)), and ((y)), as a double correction. (If you want to learn more about Elliott Wave Theory, please follow this link: Elliott Wave Theory). Last week, Disney broke the low of wave ((w)) as we expected, but did a more complex structure than an a, b, c, correction. We can see 3 waves down to complete (w) at 168.78, then the bounce to 173.87 was wave (x) and 3 more swings down to 158.95 to end the structure and wave 4.
We rallied strong from 158.95 to 172.89 and that is the wave ((i)) of 5 for us. Besides, we have seen a double correction down to 165.77 and that should be the wave ((ii)) of 5 in red. I cannot rule out a new low to complete wave ((ii)), but right now it is better to look to the upside. Thus, in this week we should see a continuation higher trying to do a (i), (ii), (iii), (iv), (v) structure that breaks wave 3 in red high.
Source: Disney Completed A Wave 4 And We Are Looking For 5 Swings Up


