Since the crash of March 2020, all stocks have tried to recover what they lost and Disney was no exception. Disney did not only recover the lost, but It also reached historic highs. Now, we are going to try to build an impulse from the March 2020 lows with a target around $230. Target measured from 0 to 2019’s high projected from March’s low, equal legs.
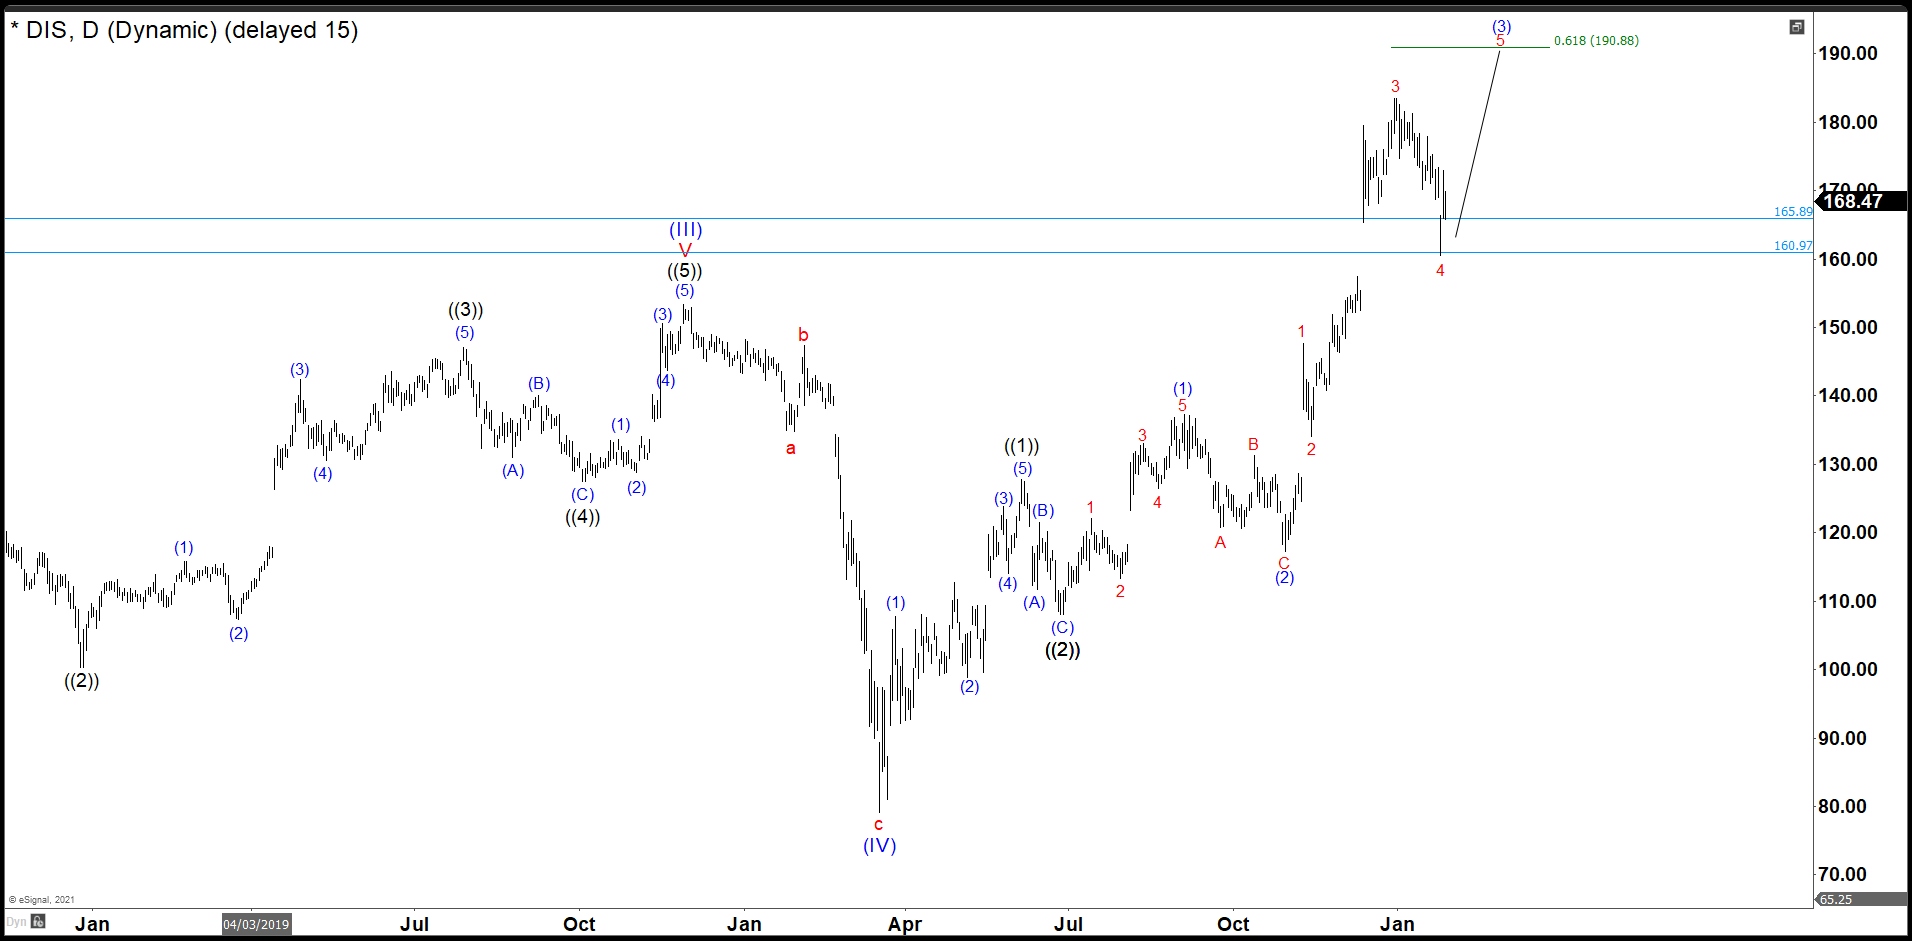
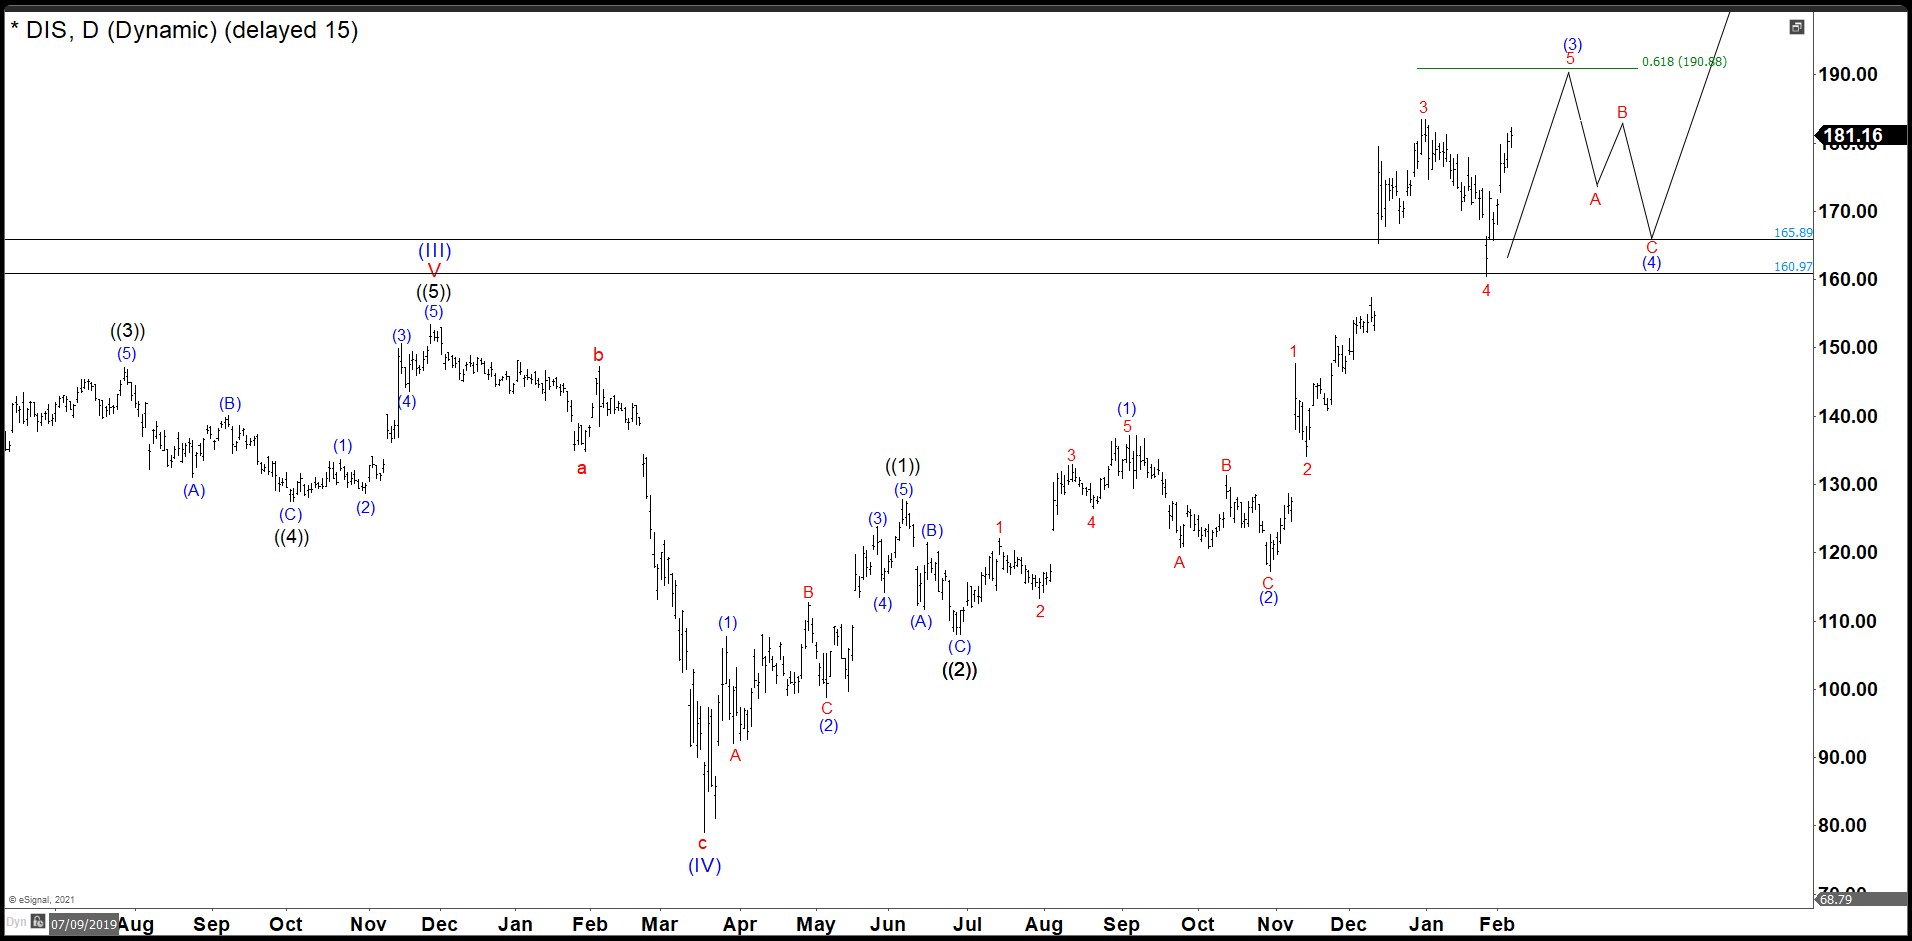
Disney Daily Chart 
As we see in the daily chart, the waves ((1)) and ((2)) of the impulse have completed and currently we are building the wave ((3)). We believe that wave (3) of ((3)) is still developing and we need one more high to complete an impulse 1, 2, 3, 4, 5 in red. We expect that the wave 5 in red reaches 190.88, ideally, to end the structure of wave (3) of ((3)).
Last week we expected to continue higher as an impulse to complete the structure of the wave (3). On Monday the market dubiously opened, but as the days passed, it began to gain upward strength and it almost reaches to break to a new historical high.
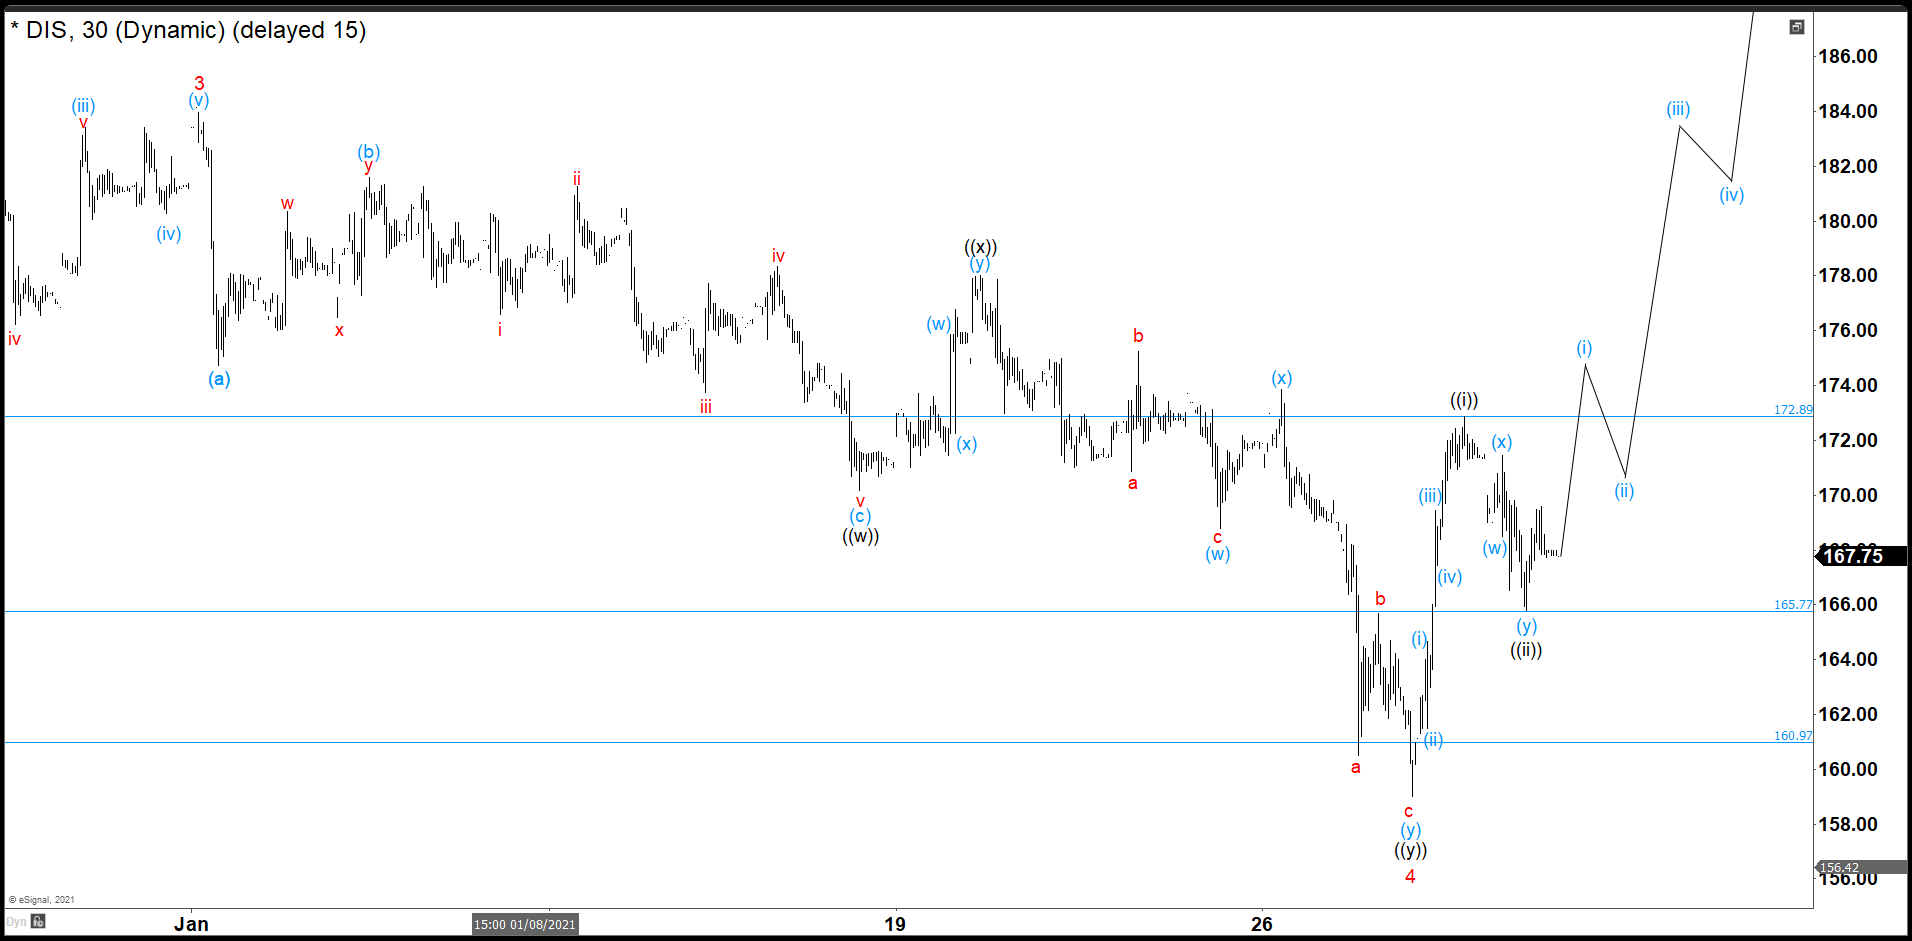
Disney 30 minutes Chart
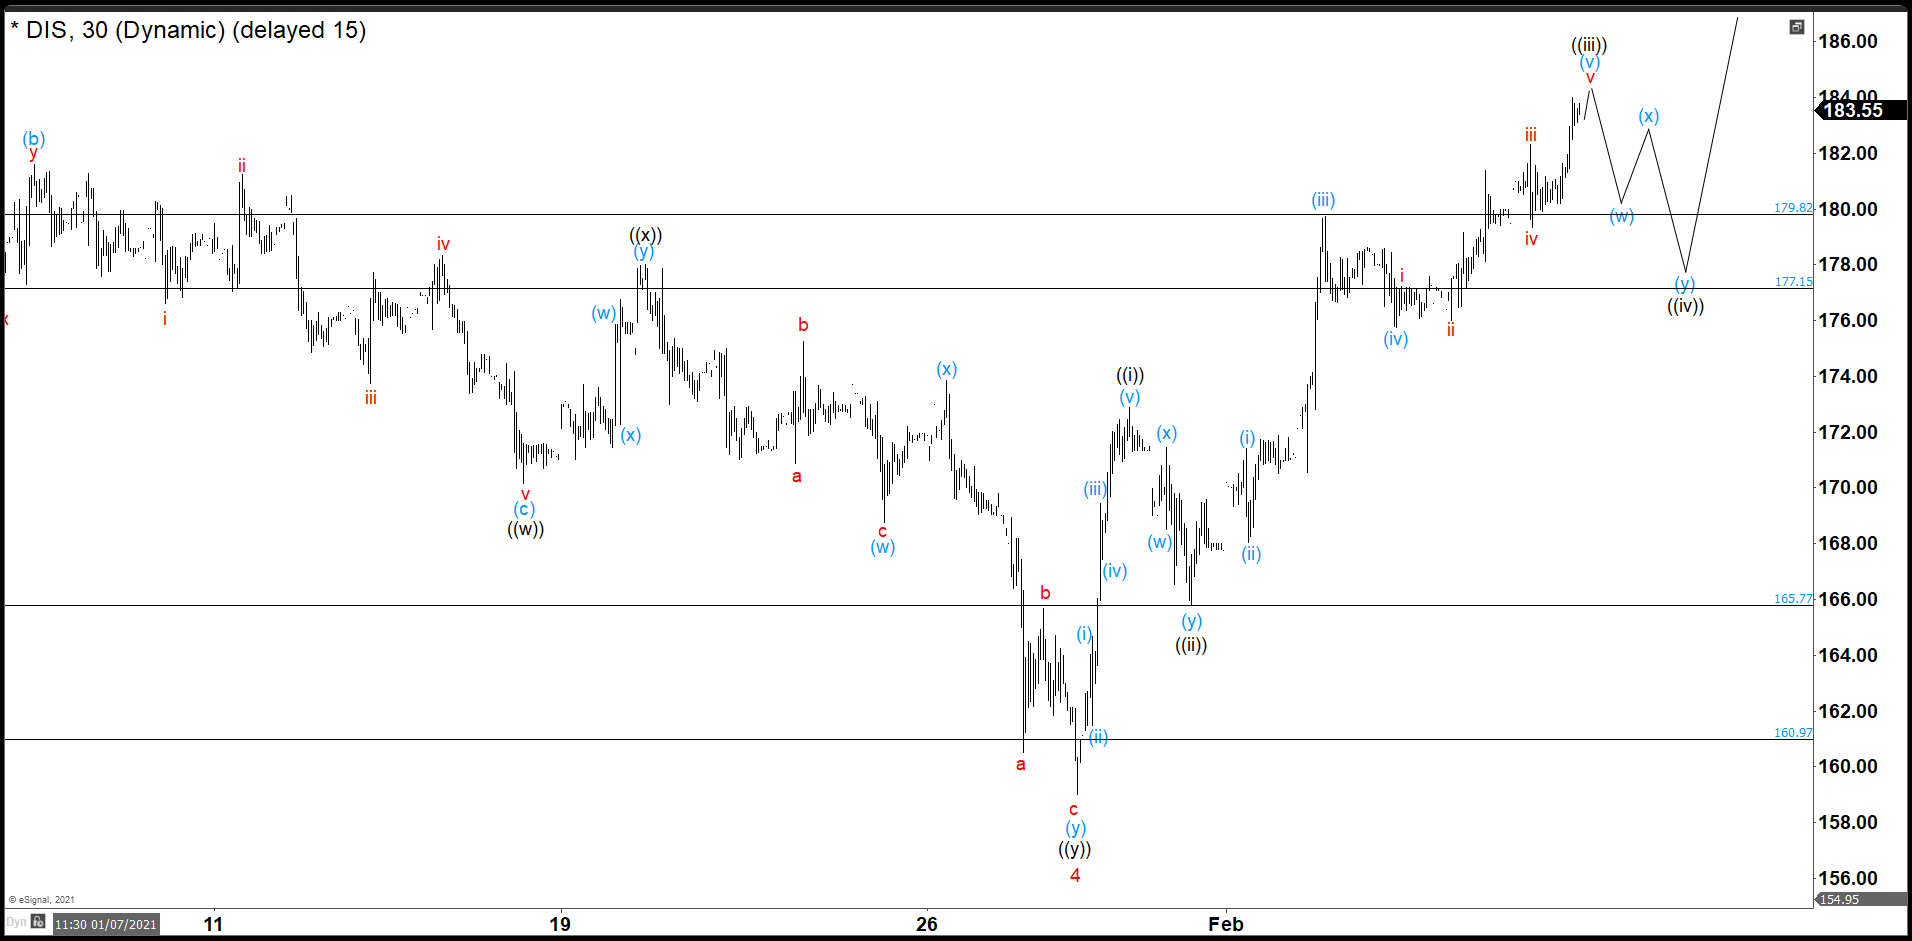
In this chart wave 4 of (3) finished. Disney built 3 waves to the downside ((w)), ((x)), and ((y)), as a double correction. (If you want to learn more about Elliott Wave Theory, please follow this link: Elliott Wave Theory). Last week, Disney broke the high of wave ((i)) as we expected and continue the rally as an impulse structure. The waves (i) and (ii) of ((iii)) were pretty small. Then the stock started to move upside and it made a temporary peak at 179.74 that we labelled as wave (iii) of ((iii)). Then we saw 3 swings down that is wave (iv) and currently we are in wave (v) of ((iii)).
Thus, in this week we should see a slightly high to complete an extended wave (v) and also complete wave ((iii)). Then we expect a double correction (w), (x), (y) to build wave ((iv)) and bounce from the 177.15 – 179.82 area. This rally should continue to 190.88 target and finish the wave ((v)) and also end the wave 5 in red and wave (3) in the daily chart.
Source: Disney Continue the Rally And Almost Reaches A New Historical High


