The Walt Disney Company, commonly known as Disney DIS, it is an American, multinational, mass media and entertainment conglomerate that is headquartered at the Walt Disney Studios complex in Burbank, California. Disney was founded on October 16, 1923, by brothers Walt and Roy O. Disney as Disney Brothers Studio.
DIS Daily Chart December 2021
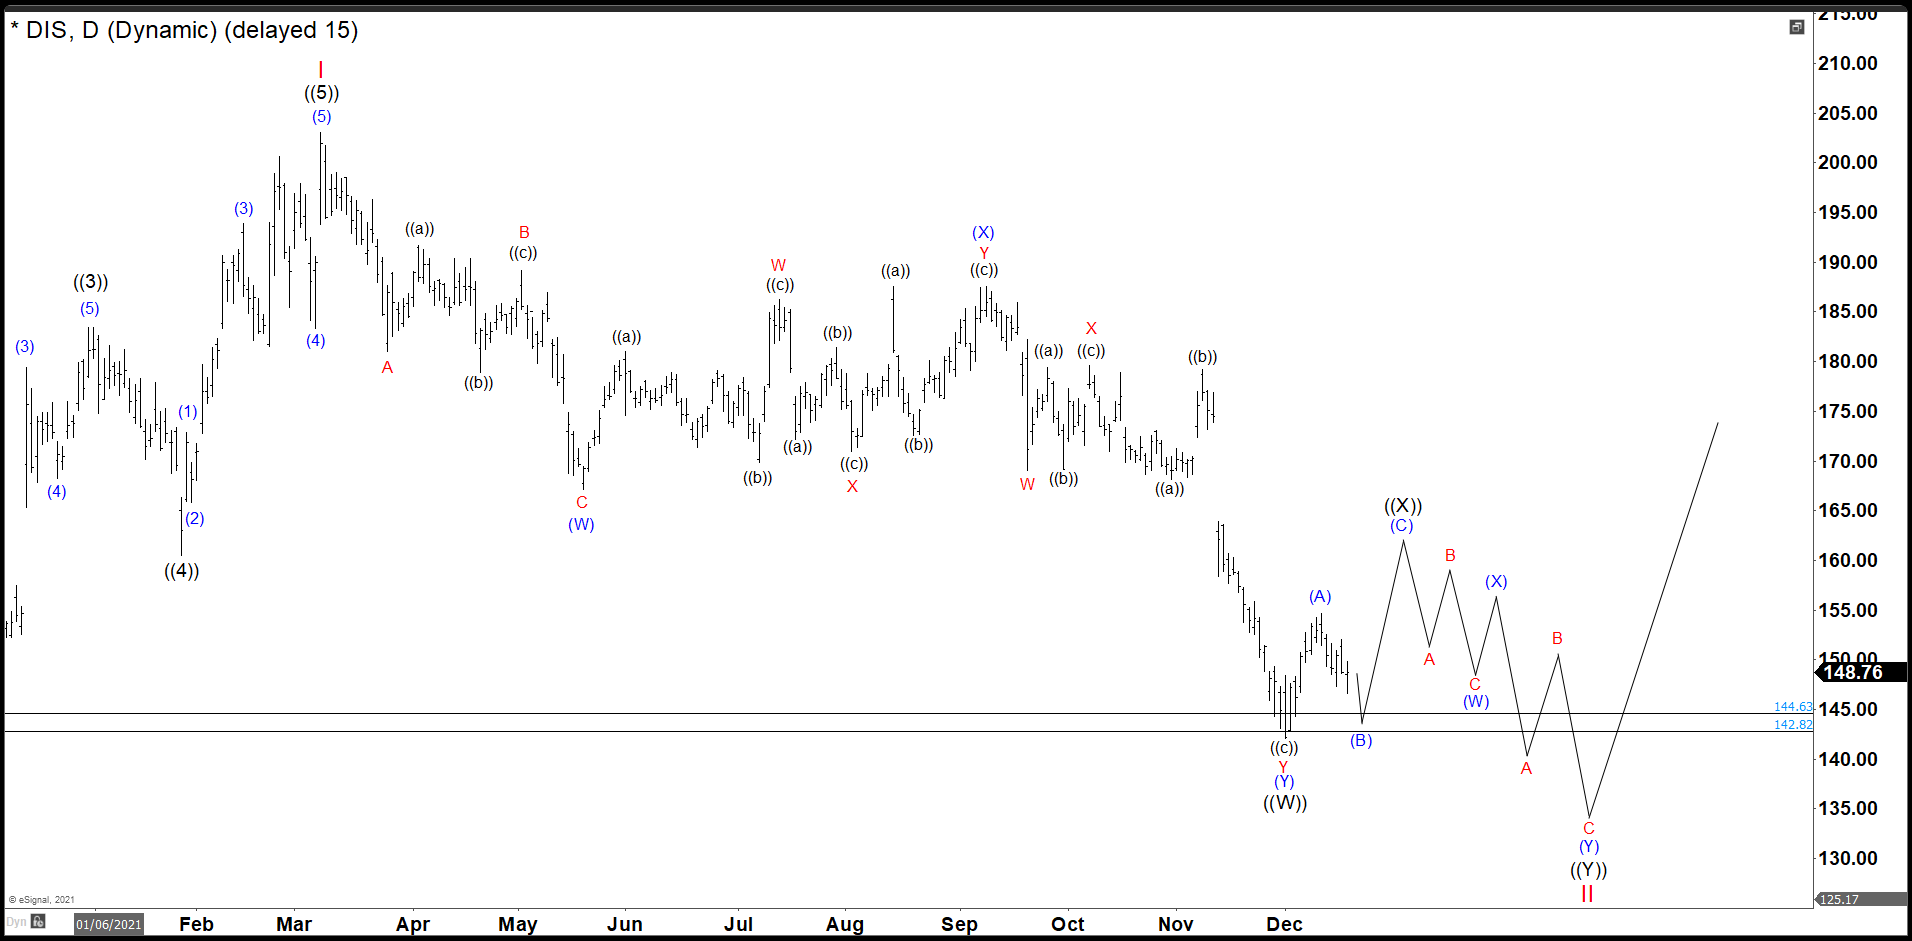
One year ago, we were looking to finish a double correction of a new cycle that started at the low of March 2020. We can see on the chart that we were building a connector ((X)) and then continued lower. However, after completing the connector DIS dropped strongly, so it is better to think that the correction that is being carried out is a Great Super Cycle correction. This means that the market is making a retracement of the entire cycle since DIS existed as a company.
DIS Quarterly Chart December 2022
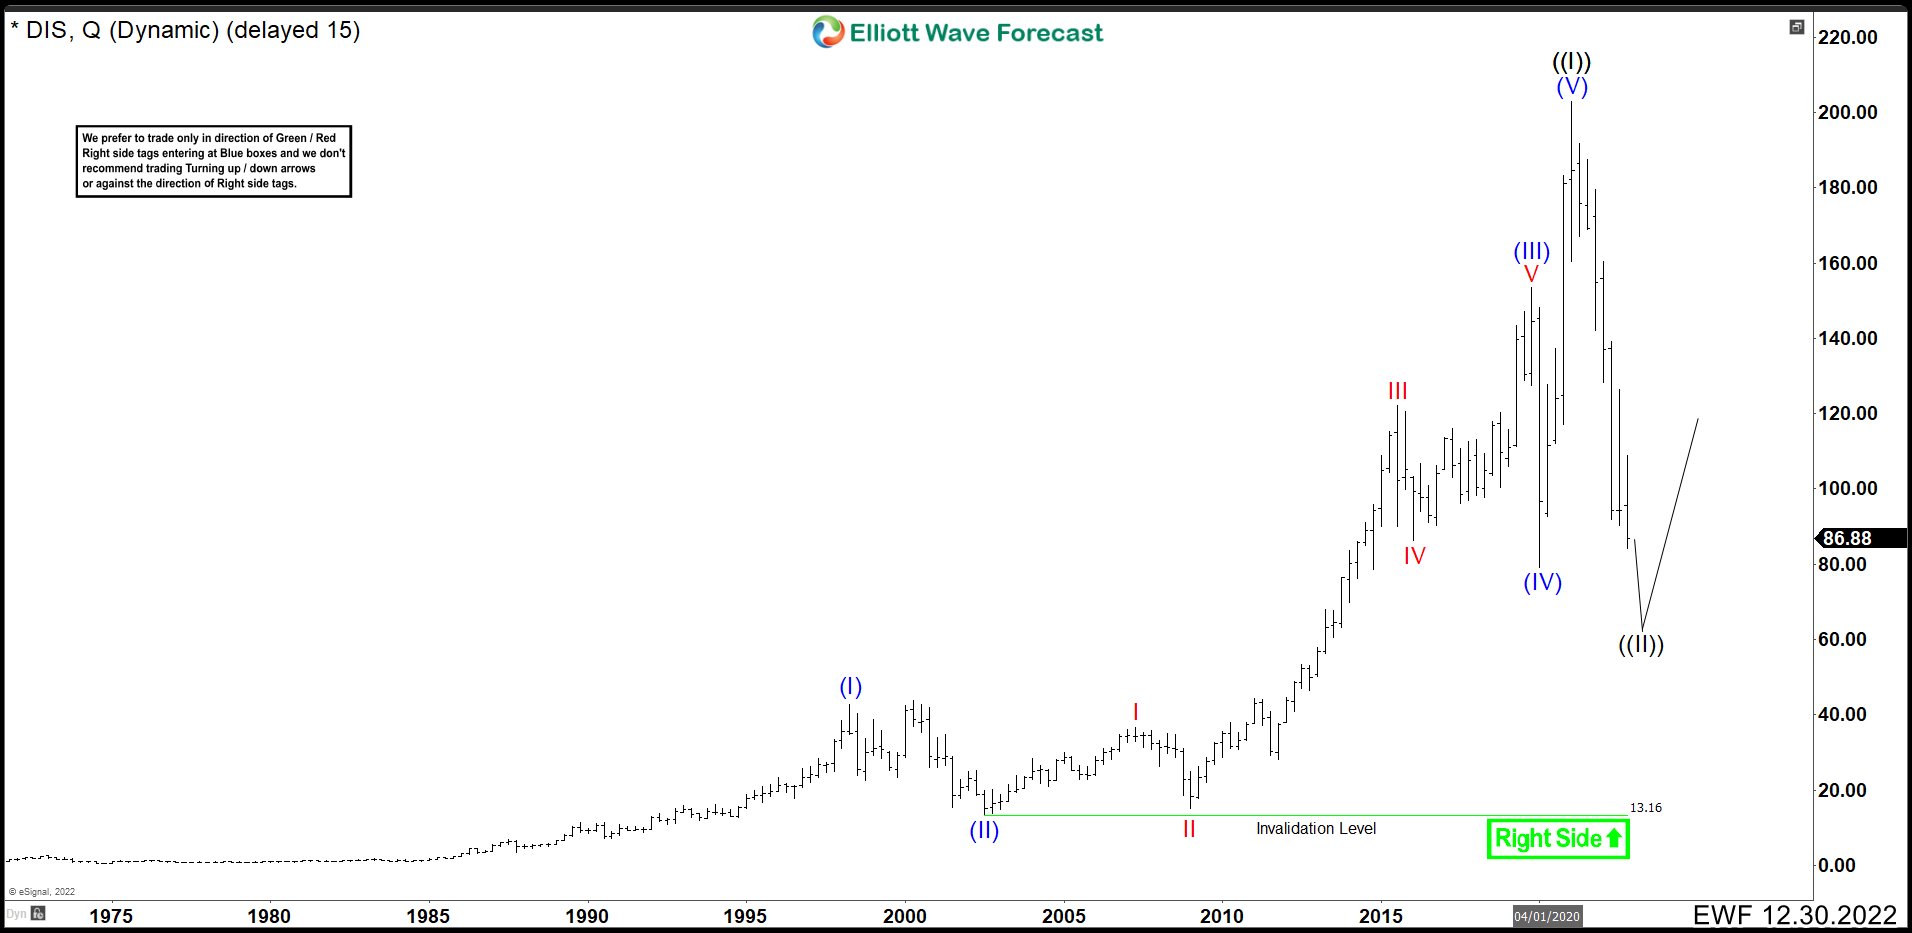
We can see on the chart, almost the entire life of the Disney stock price. The structure formed is clearly an impulse. Wave (I) ended at 42.71. Then we can see a flat correction as wave (II) ending at 13.46 in the .com recession. From there DIS went a long way to complete wave (III) at 153.41, where we can see 5 waves to the upside in red. The wave (IV) arrived at the beginning of the covid19 pandemic, ending in March 2020 at 79.07. The last rally to complete wave (V) of ((I)), of the great super cycle, ended at 203.02.
The drop from the peak has been very deep. It has already broken the 50% Fibonacci retracement taking the retracement from 0 to 203.02. The structure of wave ((II)) still looks incomplete and needs more bearish movement.
DIS Weekly Chart December 2022
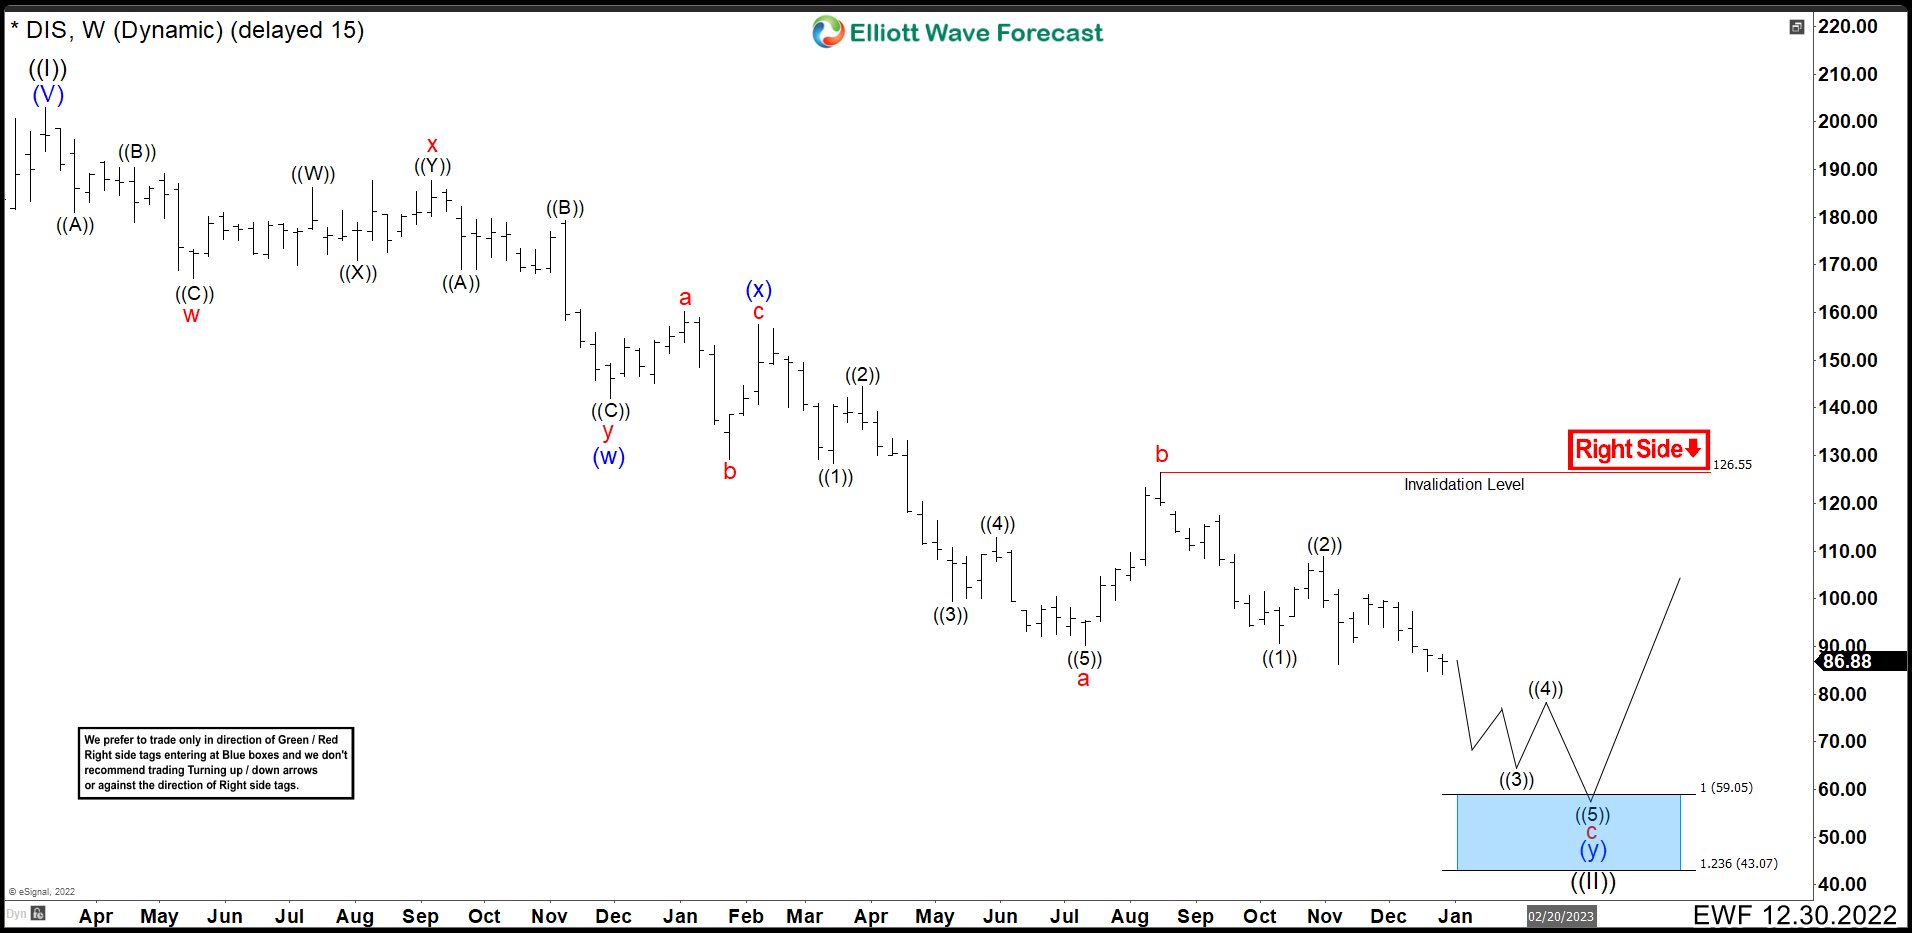
In the weekly chart we can see the entire structure of the wave ((II)) correction. The structure of wave (w) in blue took the form of a double correction 3-7-3. Connector (x) built a flat correction. This was the connector ((X)) we were looking for a year ago before continuing down. Currently, we are looking to finish a 5-3-5 zig zag correction to complete wave (y) and wave ((II)). From the b-wave high that ended at 126.55, we need to complete a bearish impulse to finish the whole correction. The bearish continuation should take us to the blue box in 59.05 - 43.07 area where the rally should continue.
Disney (DIS) is giving us a great long-term buying opportunity. The first attempt to buy is in the zone of 59.05 - 43.07. If the market breaks below this area, the next level to watch comes at 35.85. Only a break above 126.55 could give us a good alert that the correction is over and we will continue the rally. However, the only way to ensure that the wave ((II)) ended is to break the high of 203.02.
Source: https://elliottwave-forecast.com/stock-market/disney-dis-opportunity-long-term-buying/