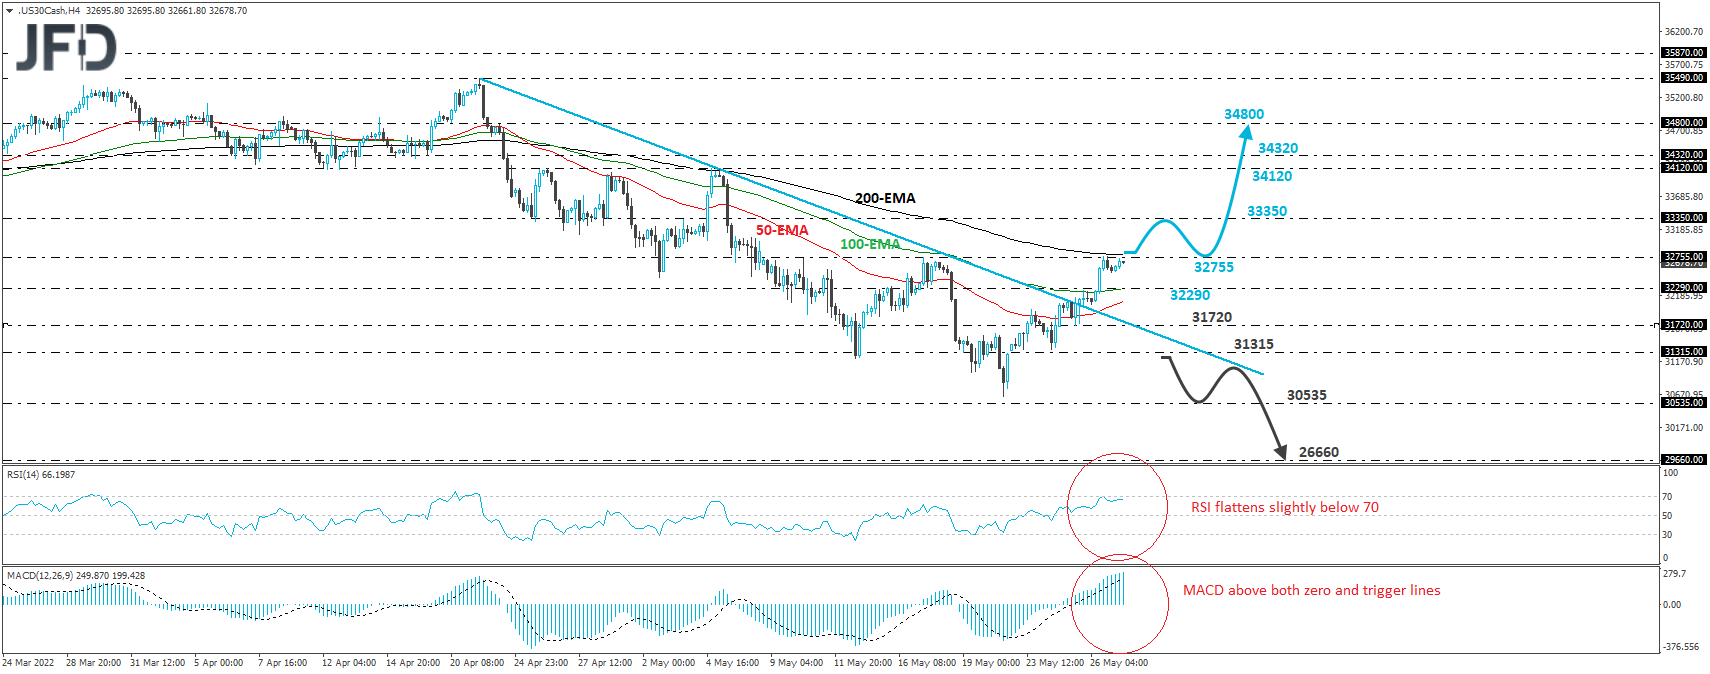
The Dow Jones Industrial Average cash index traded higher on Wednesday, breaking above the downside resistance line drawn from the high of April 21st. The index continued its recovery today as well, reaching the 32755 resistance zone, marked by the high of May 10th. Bearing in mind that the index broke the aforementioned downside line, we would see decent chances for some more advances.
A clear and decisive break above the 32755 zone could encourage the bulls to climb to the 33350 zone, marked by the high of May 3rd, and if they are not willing to stop there, then we may see them pushing towards the 34120 zone, which acted as a key resistance between April 25th and May 5th, or the 34320 barrier, defined by the inside swing low of April 19th. Should neither of those two zones hold, then we could see a test at 34800, the high of April 22nd.
Shifting attention to our short-term oscillators, we see that the RSI flattened near its 70 line, but the MACD remains above both its zero and trigger lines. Both indicators detect strong upside speed, which supports the idea of further advances, but the fact that the RSI has flattened near its 70 line make us careful over a possible setback before the next leg north.
On the downside, we would like to see a clear break below 31315 before we start examining the bearish case again. This could confirm the index’s return back below the downside resistance line taken from the high of April 21st, and could pave the way towards the 30535 zone, which is slightly below the low of May 20th, and is marked by the low of March 4th.
Disclaimer:
The content we produce does not constitute investment advice or investment recommendation (should not be considered as such) and does not in any way constitute an invitation to acquire any financial instrument or product. The Group of Companies of JFD, its affiliates, agents, directors, officers or employees are not liable for any damages that may be caused by individual comments or statements by JFD analysts and assumes no liability with respect to the completeness and correctness of the content presented. The investor is solely responsible for the risk of his investment decisions. Accordingly, you should seek, if you consider appropriate, relevant independent professional advice on the investment considered. The analyses and comments presented do not include any consideration of your personal investment objectives, financial circumstances or needs. The content has not been prepared in accordance with the legal requirements for financial analyses and must therefore be viewed by the reader as marketing information. JFD prohibits the duplication or publication without explicit approval.
CFDs are complex instruments and come with a high risk of losing money rapidly due to leverage. 72.99% of retail investor accounts lose money when trading CFDs with the Company. You should consider whether you understand how CFDs work and whether you can afford to take the high risk of losing your money. Please read the full Risk Disclosure.
Copyright 2022 JFD Group Ltd.