Électricité de France S.A. (literally, Electricity of France), commonly known as EDF, is a French multinational electric utility company. The operations include electricity generation and distribution, power plant design, construction and dismantling, energy trading and transport. Founded in 1946 and headquartered in Paris, France, the company is largely owned by the French state. EDF is a part of CAC Next 20 index. Even though the energy stock demonstrates a high attraction like that of E.ON from Germany, the stock price has strongly depreciated in 12,5 years. As a matter of fact, it has lost 93% of its value from November 2007 to March 2020.
Today, we see energy sector strongly turning up. Commodities like oil, gas, uranium are trading higher. In consequence, utility company like EDF should also catch up the overall bullish market. Therefore, investors can be looking to buy the french giant EDF in order to diversify their portfolio by indirect investment in rising commodity prices.
In the initial article from August 2021, we have called a cycle up ended in January 2021 and the price consolidation still in progress. We were right. Here, we provide an update demonstrating an inflection area, where buyers can enter the market.
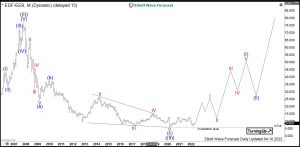
EDF Monthly Elliott Wave Analysis 04.11.2022
The monthly chart below shows the EDF stock $EDF traded at Euronext. From the all-time lows, the stock price has developed a cycle higher in black wave ((I)) of grand super cycle degree towards the all-time highs on November 2007 at 77.79. From the highs, a correction lower in black wave ((II)) has unfolded as an Elliott wave zigzag pattern. It has printed an important bottom on March 2020 at 5.71. From March 2020 lows, a new cycle in wave ((III)) has already started and should extend towards 77.79 highs and even higher.
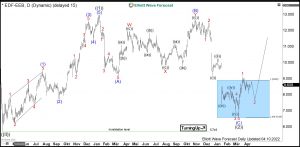
EDF Daily Elliott Wave Analysis 04.11.2022
The daily chart below shows in more detail the first stages of the advance higher in wave ((III)). From the March 2020 lows at 5.71, the initial impulsive advance in black wave ((1)) has ended at 12.98 in January 2021. From there, a correction in wave ((2)) shows 3 swings of an Elliott wave zigzag pattern. The 3rd swing in wave (C) of ((2)) has reached the 8.89-6.55 blue box area. There, on March 7th, the bounce in wave ((3)) might have started.
Investors and traders can buy EDF from 8.89-6.55 blue box area. While above 6.64 lows, the target in wave ((3)) will be 13.89-18.38 area and even higher. In a long run, EDF should break to the new all-time highs above 77.79.
Source: $EDF: French Electric Utility Stock EDF in Buying Area

