Eli Lilly & Company (LLY) discovers, develops & markets human pharmaceuticals worldwide. It is having around 550 B market cap as on December, 18th. It is based in Indianapolis, Indiana, US, comes under Healthcare sector & trades as “LLY” ticket at NYSE.
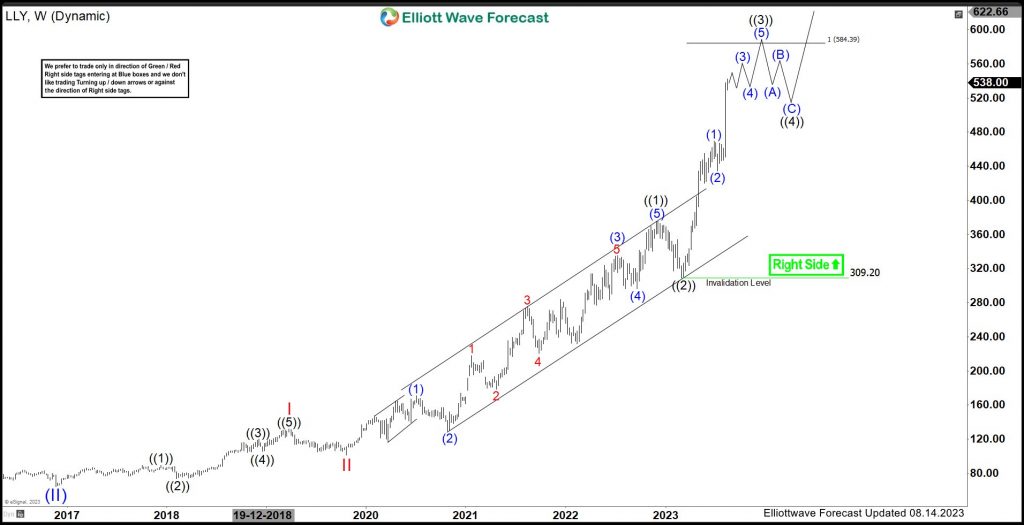
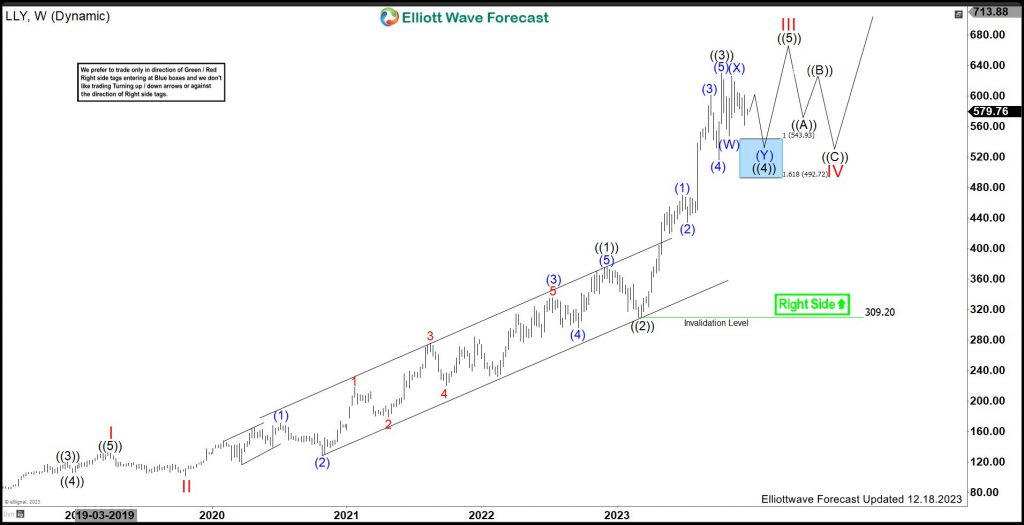
LLY reacted higher as expected in ((3)) towards $584.39 or higher levels. It ended ((3)) of III at $629.97 high & favors double correction in ((4)) before rally resumes.
LLY - Elliott Wave Weekly View From 8.14.2023: 
In Weekly sequence, it finished (I) at $92.85 high in September-2015 & (II) at $64.18 low in November-2016. Above there, it favors higher in (III) of ((III)), in which it placed I at $132.13 high & II at $101.36 low. It favors higher in third wave extension in III & expect pullback in ((4)) before rally resumes in ((5)). It placed ((1)) at $375.25 high & ((2)) at $309.20 low. Within ((1)), it finished (1) at $170.75 as diagonal structure & (2) at $129.21 low as 0.618 Fibonacci retracement. It placed (3) at $335.33 high, (4) at $296.32 low & (5) at $375.25 high.
LLY - Elliott Wave Latest Weekly View: 
It ended ((3)) of III at $629.97 high in III. Within ((3)), it placed (1) at $469.87 high, (2) at $434.34 low, (3) at $601.84 high, (4) at $516.57 low & finally (5) as ((3)) at $629.97 high. Currently, it favors pullback in ((4)) as double correction & expect choppiness. It placed (W) at $547.61 low and (X) at $625.87 high. Below there, it favors lower in (Y) of ((4)) towards $543.93 - $492.72 area as blue box. It expects to find the buyers from the blue box area to resume upside in ((5)) to finish III of (III).