By SolidECN
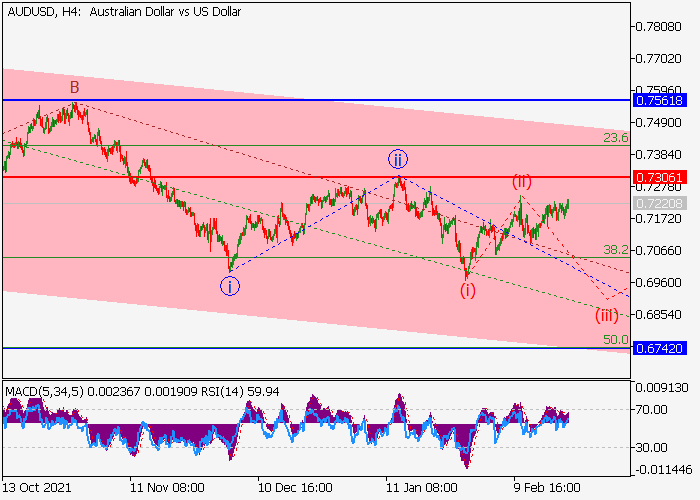
AUDUSD Elliot Wave analysis
The pair may fall.
On the daily chart, the first wave of the higher level (1) of C developed, and a downward correction forms as the wave (2) of C, within which the wave C of (2) develops. Now, the third wave of the lower level iii of C is forming, within which the wave (ii) of iii has developed, and the formation of the wave (iii) of iii has started. If the assumption is correct, the pair will fall to the levels of 0.6742–0.6446. In this scenario, critical stop loss level is 0.7306.
2 Likes
JPMorgan Chase & Co.
The price is in a correction, a fall is possible.
On the daily chart, the third wave of the higher level 3 developed, within which the wave (5) of 3 formed, and a downward correction started to develop as the wave 4. Now, the wave (А) of 4 is forming, within which a local correction has ended as the wave 4 of (A), and the fifth wave 5 of (A) is developing. If the assumption is correct, the price will fall to the levels of 118.00–101.00. In this scenario, critical stop loss level is 158.88.
Trade with a True ECN Broker
Solid ECN Securities
NZDUSD Elliot wave analysis by SolidECN
The pair is in a correction, a fall is possible.
On the daily chart, the upward wave of the higher level (А) of B formed, and a downward correction develops as the wave (B) of B, within which the wave C of (B) forms. Now, the third wave of the lower level iii of C has formed, and a local correction is ending to develop as the fourth wave iv of C, within which the wave © of iv is forming. If the assumption is correct, after the end of the correction, the pair will fall to the levels of 0.6466–0.6224. In this scenario, critical stop loss level is 0.6890.
Trade with a True ECN Broker
Solid ECN Securities
USDCAD pair is in a correction and may grow.
On the daily chart, the first wave of the higher level (1) of 5 forms, within which the wave 3 of (1) develops. Now, the third wave of the lower level iii of 3 is developing, within which the wave (i) of iii has formed, and a local correction is ending as the wave (ii) of iii. If the assumption is correct, after the end of the correction, the pair will grow to the levels of 1.3200–1.3410. In this scenario, critical stop loss level is 1.2578.
Trade with a True ECN Broker
Solid ECN Securities
Elliot Wave Analysis by Solid ECN Securities
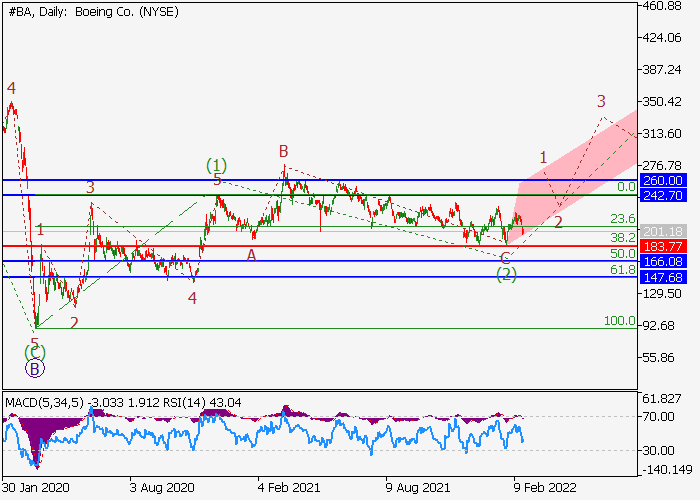
Boeing Co. wave analysis | The price may grow.
On the daily chart, the first wave of the higher level (1) of C formed, and a correction developed as the second wave (2) of C, and the development of the third wave (3) of C started. Now, the first entry wave of the lower level 1 of (3) is forming, within which the wave i of 1 has formed, and the wave ii of 1 is ending. If the assumption is correct, the price will grow to the levels of 242.70–260.00. In this scenario, critical stop loss level is 183.77.
Trade with a True ECN Broker
Solid ECN Securities
1 Like
Elliot Wave Analysis by Solid ECN
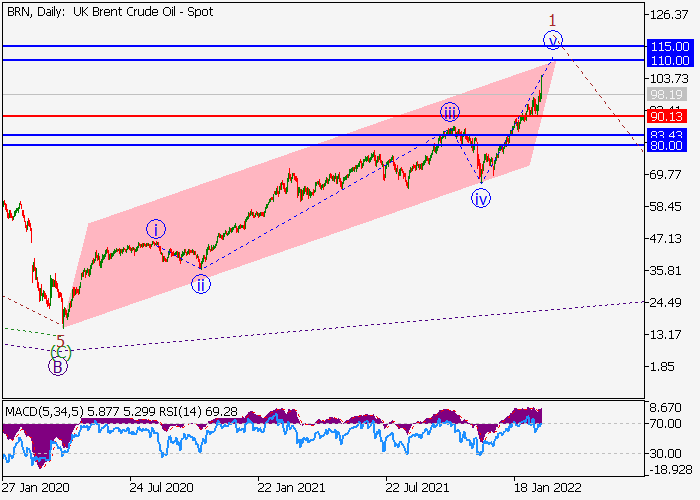
Crude Oil, The price may grow.
On the daily chart, the upward wave C forms, within which the first wave 1 of (1) of C develops. Now, the fifth wave of the lower level v of 1 is forming, within which a local correction has ended as the wave (iv) of 1, and the wave (v) of 1 is developing. If the assumption is correct, the price will grow to the levels of 110.00–115.00. In this scenario, critical stop loss level is 90.13.
Trade with a True ECN Broker
Solid ECN Securities
Elliot Wave Analysis by Solid ECN
Gold may grow.
On the daily chart, the fifth wave of the higher level (5) develops, within which the wave 3 of (5) forms. Now, the third wave of the lower level iii of 3 is developing, within which the wave (iii) of iii is forming. If the assumption is correct, the pair will grow to the levels of 2067.60–2150.00. In this scenario, critical stop loss level is 1853.14.
Trade with a True ECN Broker
Solid ECN Securities
Elliot Wave Analysis by Solid ECN
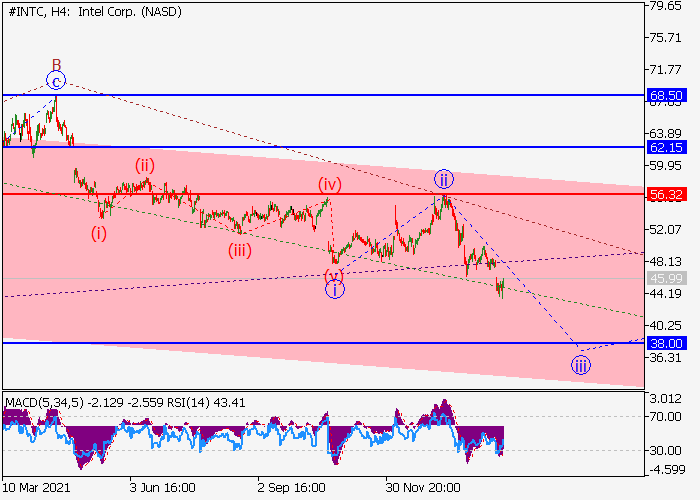
Intel Corp.
The price may fall.
On the daily chart, a downward correction of the higher level develops as the second wave (2), within which the wave C of (2) forms. Now, the first wave of the lower level i of C has formed, a local correction has ended as the wave ii of C, and the third wave iii of C is developing. If the assumption is correct, the price will fall to the levels of 38.00–31.50. In this scenario, critical stop loss level is 56.32.
Trade with a True ECN Broker
Solid ECN Securities
Elliot Wave Analysis by Solid ECN Securities
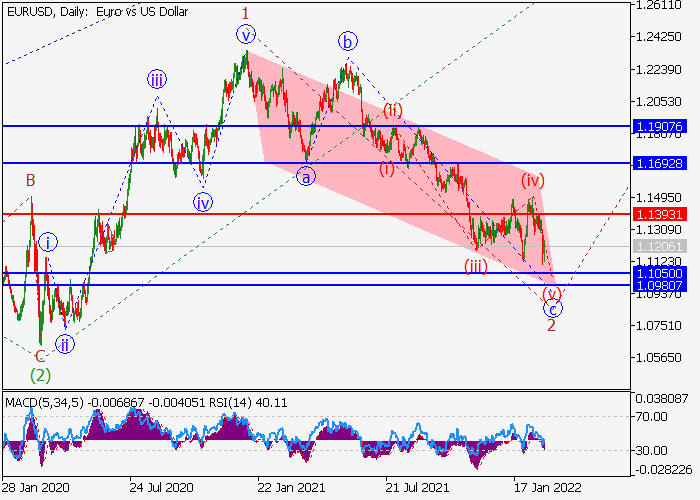
EURUSD pair may fall.
On the daily chart, the first wave of the higher level 1 of (3) formed, and a downward correction develops as the second wave 2 of (3), within which the wave c of 2 forms. Now, a local correction has ended as the fourth wave of the lower level (iv) of c, and the fifth wave (v) of c is developing. If the assumption is correct, the pair will fall to the levels of 1.1050–1.0980. In this scenario, critical stop loss level is 1.1393.
Trade with a True ECN Broker
Solid ECN Securities
Elliot Wave Analysis by Solid ECN Securities
GBPUSD is in a correction and may grow.
On the daily chart, the first wave of the higher level (1) formed, a downward correction developed as the wave (2), and the development of the third wave (3) started. Now, the first entry wave of the lower level i of 1 of (3) has formed, and a local correction is ending to develop as the second wave ii of 1, within which the wave © of ii is forming. If the assumption is correct, after the end of the correction, the pair will grow to the levels of 1.4000–1.4246. In this scenario, critical stop loss level is 1.3160.
Trade with a True ECN Broker
Solid ECN Securities
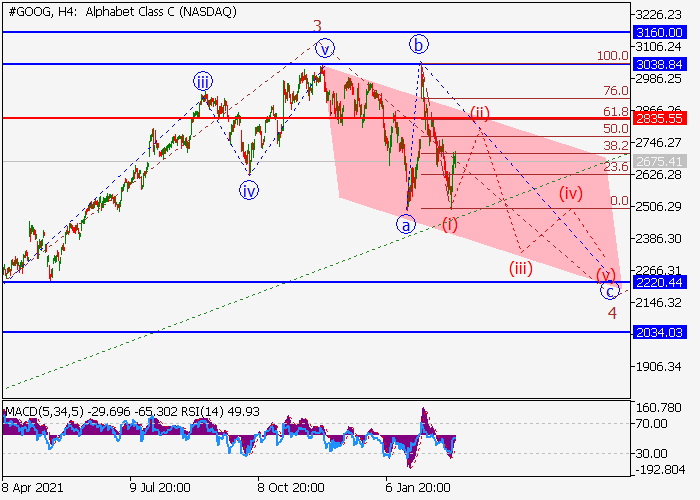
Google is in a correction, a fall is possible.
On the daily chart, the third upward wave of the higher level (3) develops, within which the wave 3 of (3) formed, and a downward correction develops as the fourth wave 4 of (3). Now, the wave a of 4 has formed, the correctional wave b of 4 has developed, and the wave c of 4 is forming, within which the wave (ii) of c is developing. If the assumption is correct, after the end of the correction, the price will fall to the levels of 2220.44–2034.03. In this scenario, critical stop loss level is 2835.55.
Trade with a True ECN Broker
Solid ECN Securities
Elliot Wave Analysis by Solid ECN
USDCAD may grow.
On the daily chart, the first wave of the higher level (1) of 5 forms, within which the wave 3 of (1) develops. Now, the third wave of the lower level iii of 3 is developing, within which the wave (i) of iii has formed, and a local correction has ended as the wave (ii) of iii. If the assumption is correct, the pair will grow to the levels of 1.3200–1.3410. In this scenario, critical stop loss level is 1.2609.
Trade with a True ECN Broker
Solid ECN Securities
USDCHF pair may fall.
On the daily chart, the first downward wave of the higher level (1) of 3 formed, an upward correction developed as the second wave (2) of 3, and the development of the third wave (3) of 3 started. Now, the first wave of the lower level i of 1 of (3) has formed, the local correction ii of 1 of (3) has developed, and the wave iii of 1 of (3) is forming, within which the wave (iii) of iii is developing. If the assumption is correct, the pair will fall to the levels of 0.9014–0.8921. In this scenario, critical stop loss level is 0.9285.
Trade with a True ECN Broker
Solid ECN Securities
Elliot Wave Analysis by Solid ECN
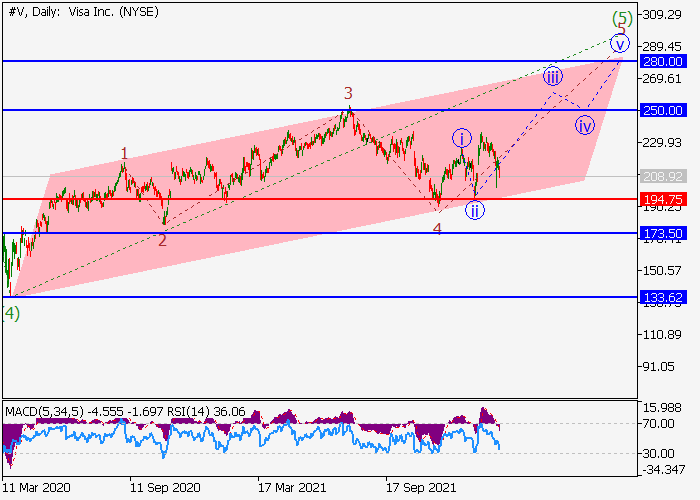
Visa Inc, The price may grow.
On the daily chart, the fifth wave of the higher level (5) develops, within which the third wave 3 of (5) formed, and a downward correction developed as the fourth wave 4 of (5). Now, the fifth wave of the lower level 5 of (5) is developing, within which the wave iii of 5 is forming. If the assumption is correct, the price will grow to the levels of 250.00–280.00. In this scenario, critical stop loss level is 194.75.
Trade with a True ECN Broker
Solid ECN Securities
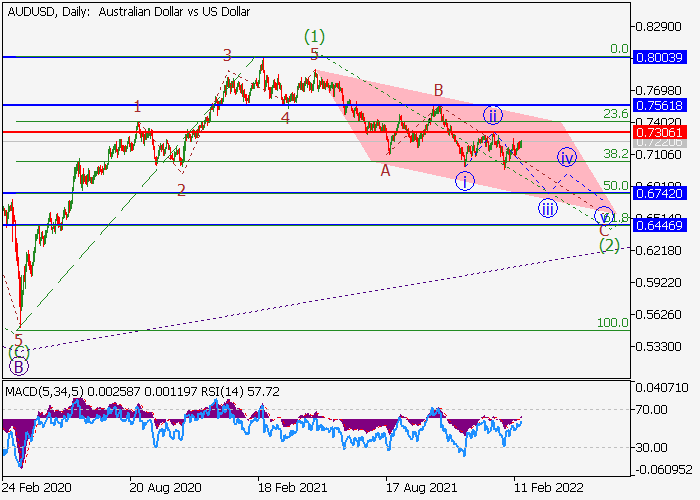
AUDUSD is in a correction, a fall is possible
On the daily chart, the first wave of the higher level (1) of C developed, and a downward correction forms as the wave (2) of C, within which the wave C of (2) develops. Now, the first wave of the lower level i of C formed, and a local correction is ending to develop as the wave ii of C, within which the formation of the wave © of ii is ending.
If the assumption is correct, after the end of the correction, the pair will fall to the levels of 0.6742–0.6446. In this scenario, critical stop loss level is 0.7563.
Trade with a True ECN Broker
Solid ECN Securities
Elliot Wave Analysis by Solid ECN
Amazon price is in a correction, a fall is possible.
On the daily chart, the third upward wave of the higher level (3) developed, and a downward correction develops as the fourth wave (4). Now, the wave and of (4) has formed, and a local correction is developing as the wave B of (4), within which the wave c of B is forming.
If the assumption is correct, after the end of the correction, the price will fall to the levels of 2529.07–2241.16. In this scenario, critical stop loss level is 3356.92.
Trade with a True ECN Broker
Solid ECN Securities
Elliot Wave Analysis by Solid ECN
Alibaba Group Holdings Ltd, The price may fall.
On the daily chart, the first upward wave of the higher level 1 formed, and a downward correction develops as the wave 2. Now, the wave © of 2 is forming, within which the development of the fifth wave of the lower level 5 of © has started.
If the assumption is correct, the price will fall to the levels of 75.00–56.00. In this scenario, critical stop loss level is 128.91.
Trade with a True ECN Broker
Solid ECN Securities
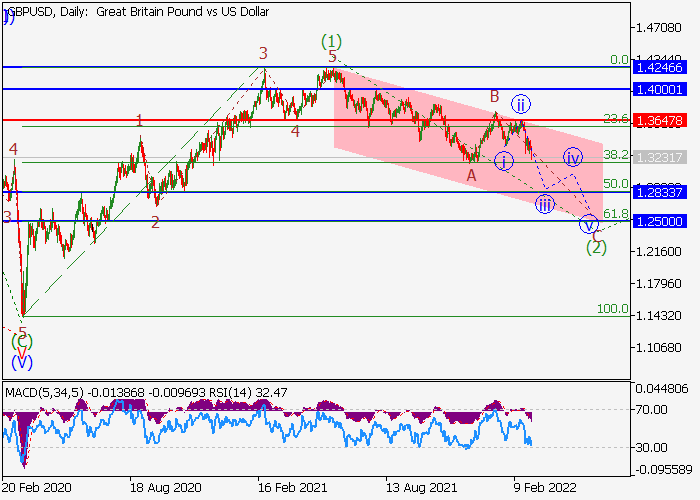
Elliot Wave Analysis By Solid ECN
GBPUSD is in a correction, a fall is possible.
On the daily chart, the first wave of the higher level (1) formed, and a downward correction develops as the wave (2). Now, the wave and of (2) has formed, a local correction has developed as the second wave B of (2), and the wave C of (2) is forming, within which the wave iii of C is developing.
If the assumption is correct, the pair will fall to the levels of 1.2833–1.2500. In this scenario, critical stop loss level is 1.3647.
Trade with a True ECN Broker
Solid ECN Securities
Silver may grow.
On the daily chart, the first wave of the higher level (1) of 3 formed, and a downward correction developed as the wave (2) of 3, within which the wave C of (2) formed. Now, the development of the third wave (3) of 3 has started, within which the first wave of the lower level i of 1 of (3) formed, a local correction has started to develop as the wave ii of 1 of (3).
If the assumption is correct, after the end of the correction, the price will grow to the levels of 27.00–28.40. In this scenario, critical stop loss level is 23.2.
Trade with a True ECN Broker
Solid ECN Securities
Bank of America, the price may fall.
On the daily chart, the first wave of the higher level 1 formed, and a downward correction develops as the second wave 2. Now, the wave (А) of 2 is forming, within which the third wave of the lower level 3 of (А) is developing. If the assumption is correct, the price will fall to the levels of 35.00–31.90.
In this scenario, critical stop loss level is 44.38.ect, the price will fall to the levels of 74 – 50. In this scenario, critical stop loss level is 113.8.
Trade with a True ECN Broker
Solid ECN Securities