Welcome traders, today we look at a couple of 1 hour NIKKEI charts and its price action within 3 consecutive days. The following analysis will show how profitable and efficient it can be to trade with our philosophy and basic Elliott Wave analysis.
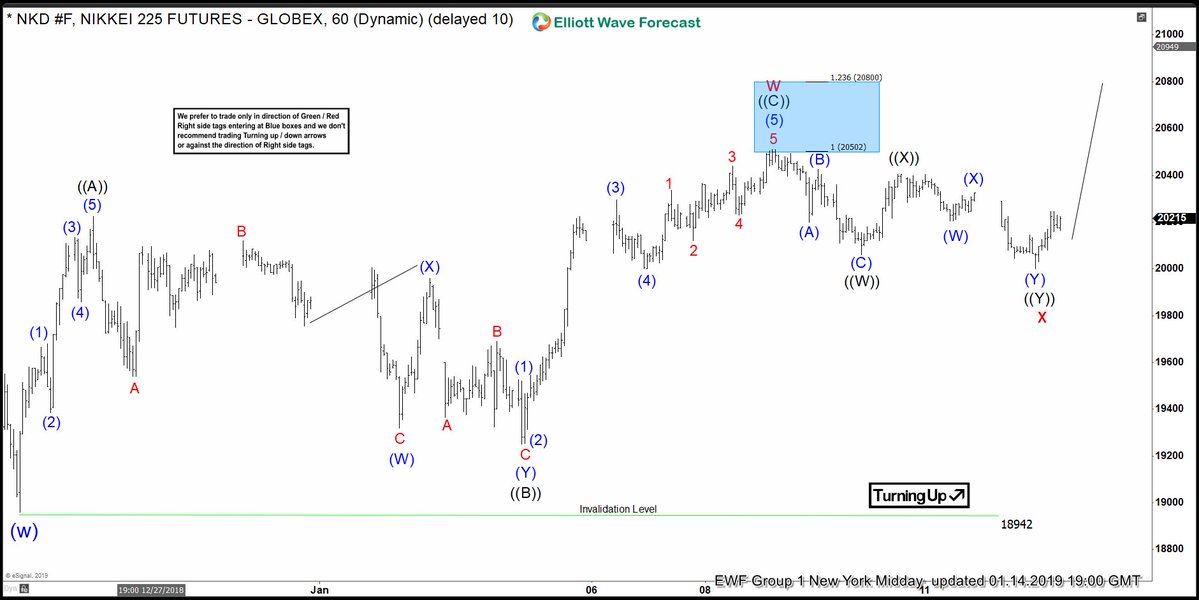
First of all, we start on January 14 where the right side of the market favored the upside. A 3 waves structure, ((A))-((B))-(©), concluded a proposed wave ‘W’. Also, wave ‘W’ successfully reached our blue box target areas from which we always expect a reaction. The blue box target areas are derived by a 1:1 and 1:1.236 ratio of wave ((A)) projected from wave ((B)). Consequently, the reaction off of the blue box confirmed the idea of the cycle ending. The full 3 waves correction has an invalidation level of 18942 for further upside.
Under our methodology, every finished cycle that ends within our blue box target areas are followed by a corrective pullback. These corrective pullbacks should unfold in 3,7, or 11 swings before it continues its dominant trend. With this in mind, our count at the time suggested a pullback of a total of 7 swings had finished. This completed the pullback sequence and the index can resume the upside.
NIKKEI 1.14.2019 1 Hour Chart Elliott Wave Analysis

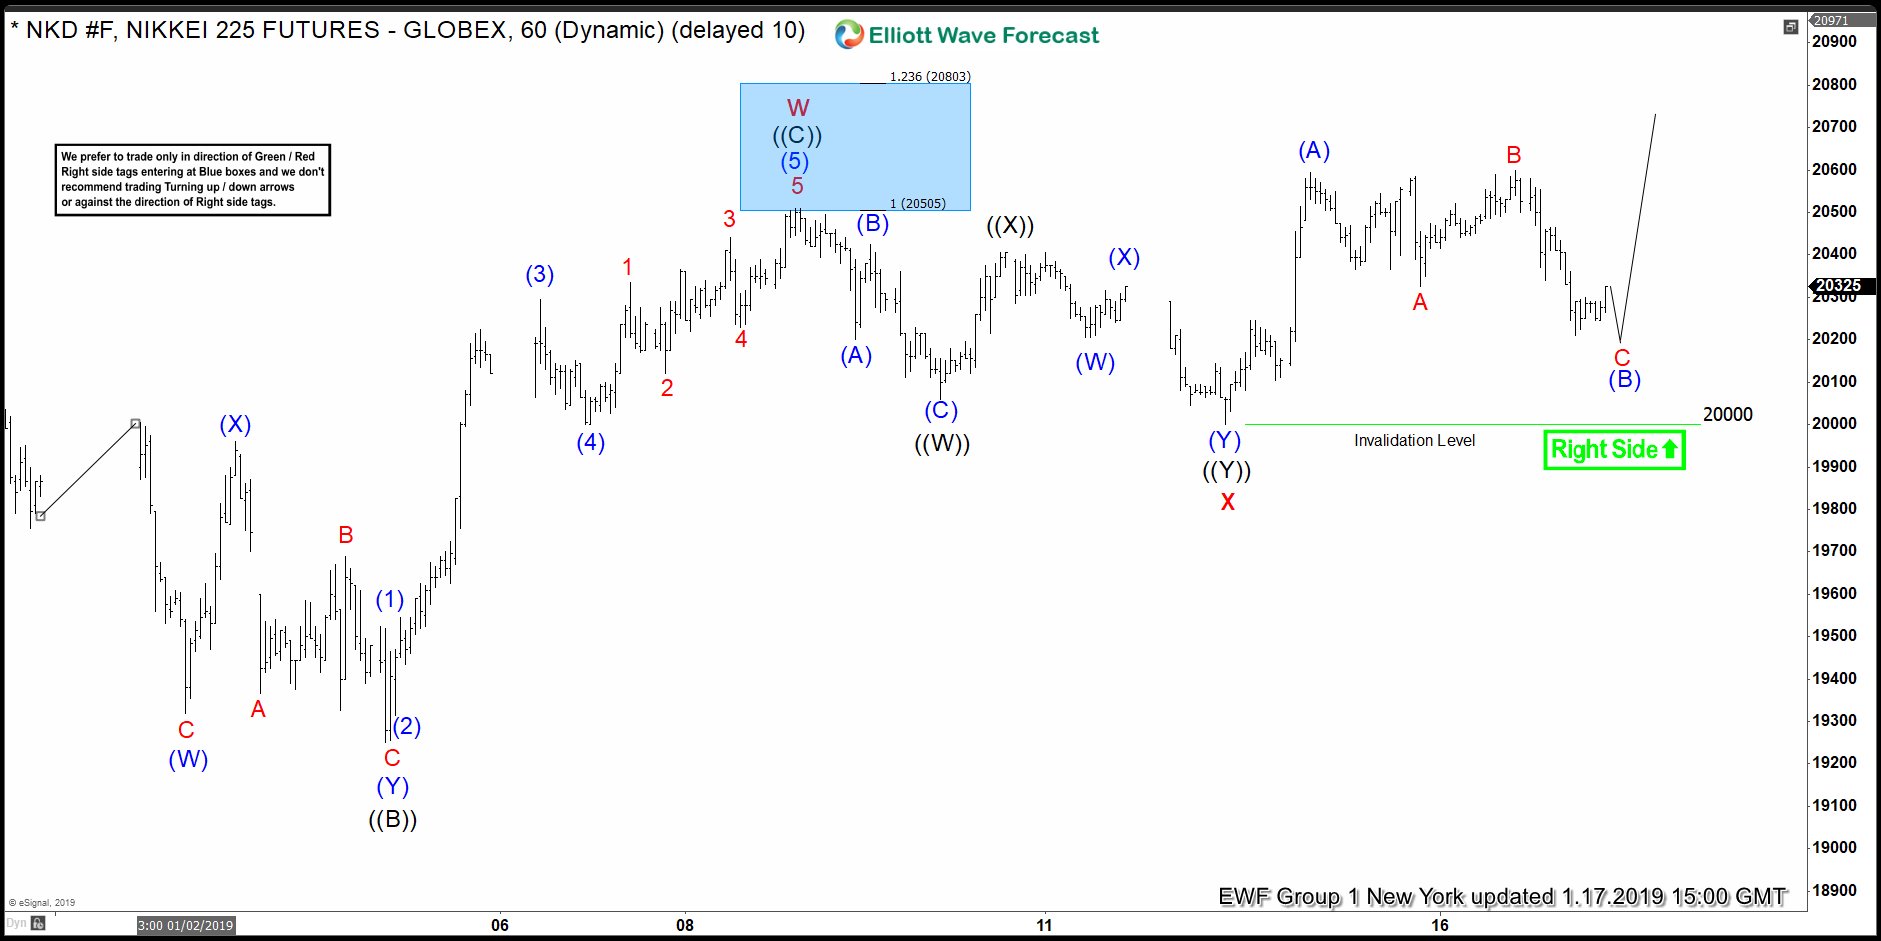
Below you will see an updated chart of the index two days after, January 16 2019. So, as expected, with a complete 7 swing pullback, the index was able to resume the dominant trend. Under our aggressive approach, our members are able to react to these situations. A combination of signals, like our invalidation level, blue box target areas, and “the right side of the market”, add up to great trading opportunities. From here, we wait, and repeat the process. Notice how we immediately provide an invalidation level and forecast the next move. We do not claim to be always right, but we do certainly have the odds on our favor.
NIKKEI 1.16.2019 1 Hour Chart Elliott Wave Analysis

*Note : Keep in mind the market is dynamic and the presented view might have changed after the post was published.