Las Vegas Sands Corp. (NYSE: LVS), a prominent player in the global integrated resort industry, has seen its fortunes shift amidst changing landscapes in the world of entertainment and hospitality. This article delves into the present Elliott Wave analysis for the stock, exploring two potential pathways based on Elliott Wave Theory and future prospects.
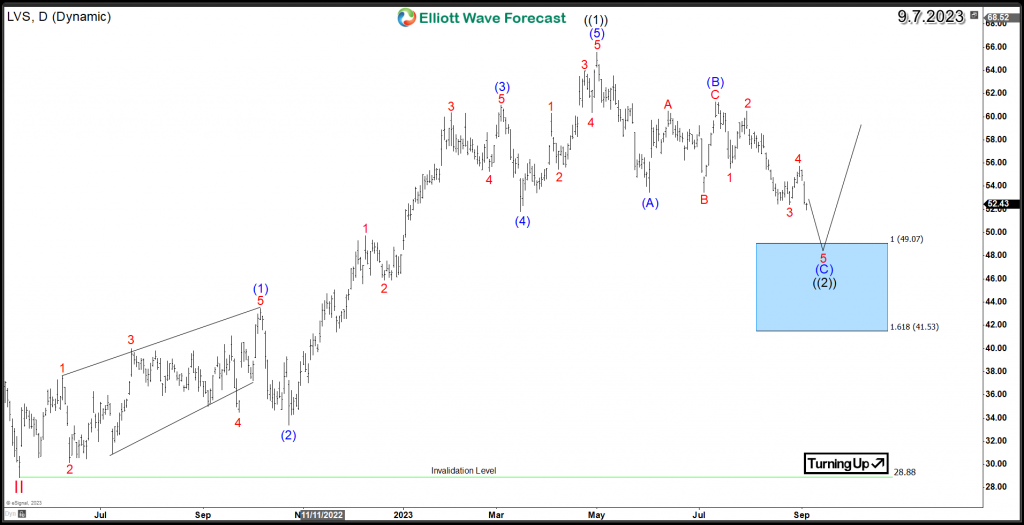
Examining LVS’s daily chart, the rally that commenced in May 2022 unfolded as an impulsive 5-wave advance, reaching $65.5 in May 2023 to mark wave ((1)). Although the year-long rally didn’t surpass the 2018 peak of $81, it created a bullish structure.
LVS is presently engaged in correcting the prior daily cycle within wave ((2)) and initiating an initial 3-wave pullback through a Zigzag structure. This descent, consisting of 3 swings, is targeted towards the blue box area, located at equal legs $49 - $41. At this point, LVS anticipates two potential scenarios:
- A strong and impulsive rebound, enabling buyers to initiate the subsequent upswing within wave ((3)) and potentially break into new all-time highs.
- A corrective bounce that fails to surpass the May peak, followed by another 3-wave descent, forming a larger double-three correction ( 7 swings ) within wave ((2)). Subsequently, the stock may resume its upward trajectory in wave ((3)).
Both scenarios are expected to remain above the 2022 low $28.88 to allow the stock to resume higher within the bullish trend. Investors will be looking to use the High-frequency Blue Box areas where the market is likely to end cycles and make a turn.
