Silver Miners (SIL) reached the support area from August 6 peak in 7 swing and reacted higher. However, in the last few trading sessions, the ETF has taken a turn lower. What’s the outlook for the ETF and what alternative should we consider? Let’s take a look at the Elliott Wave update below:
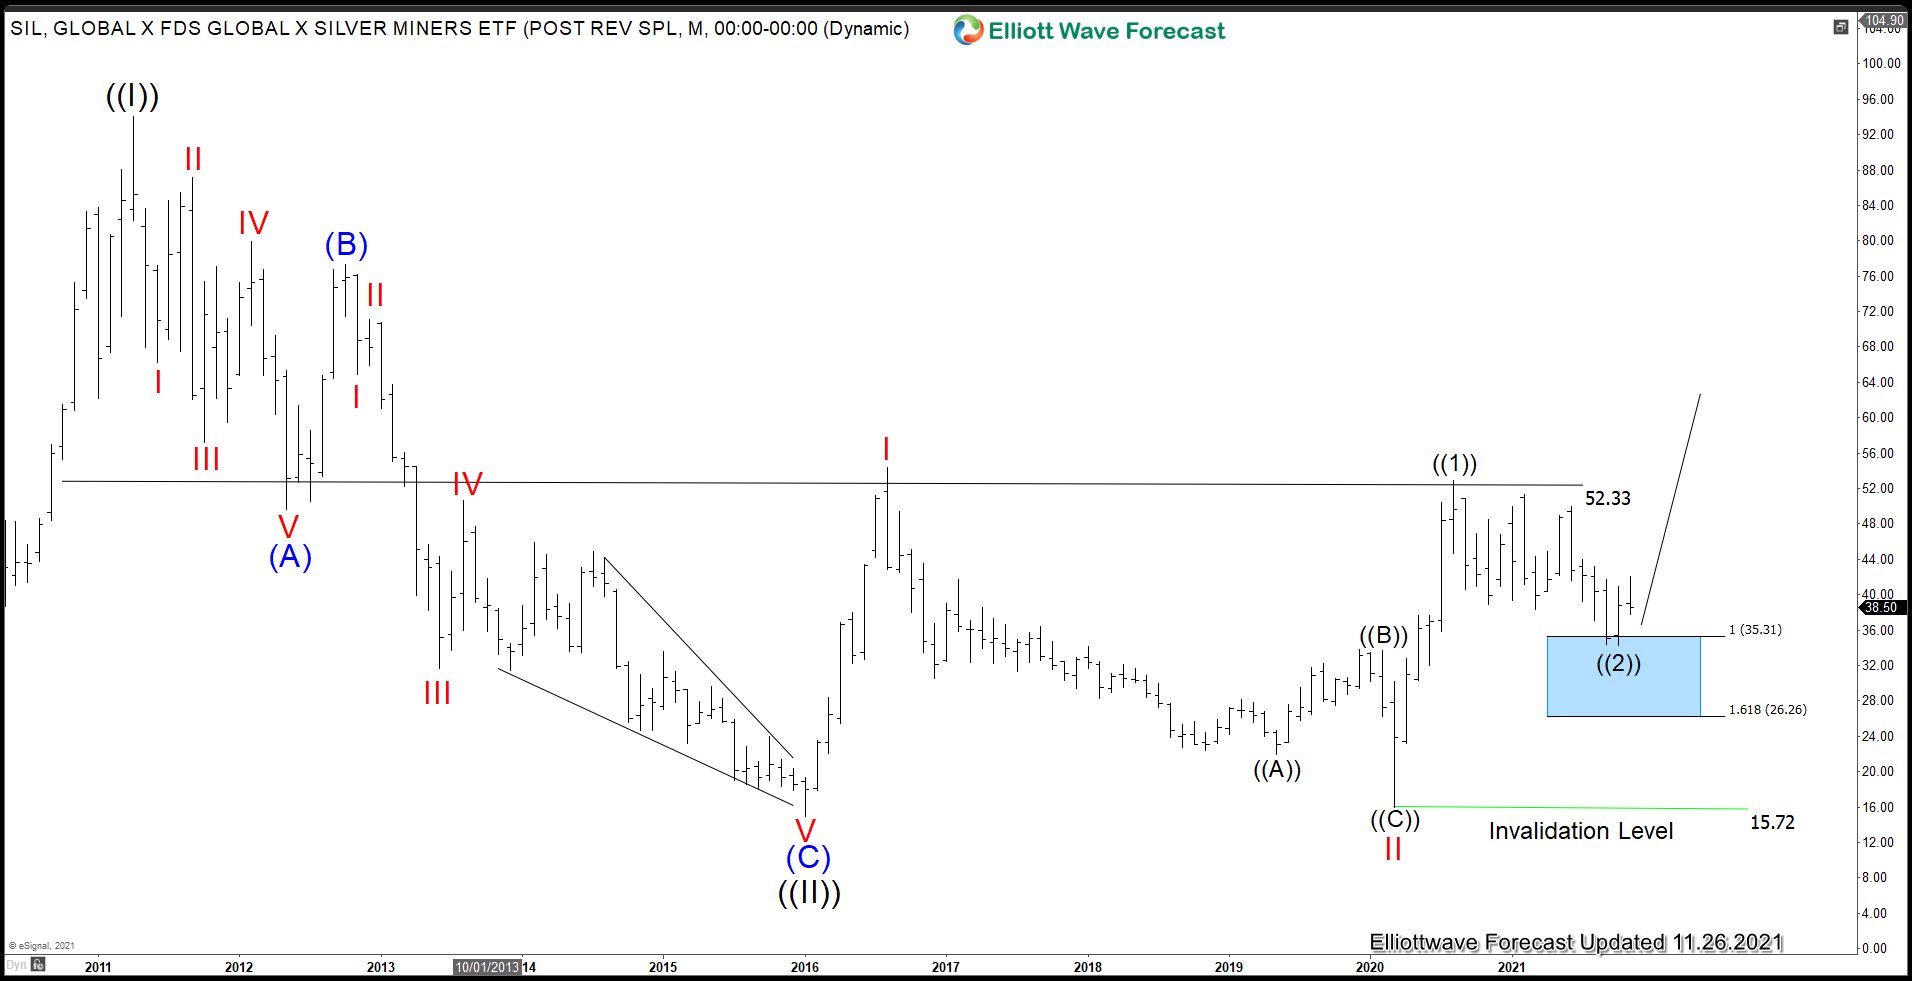
SIL Monthly Elliott Wave Chart
The Monthly Chart above shows that SIL may have ended wave ((2)) pullback at $34.21 inside the blue box. In case it breaks below $34.21 again, then the ETF simply extends lower but still within wave ((2)) and the blue box area between $26.26 - $35.31 remains the area where a base is expected to form for the next leg higher in the ETF.
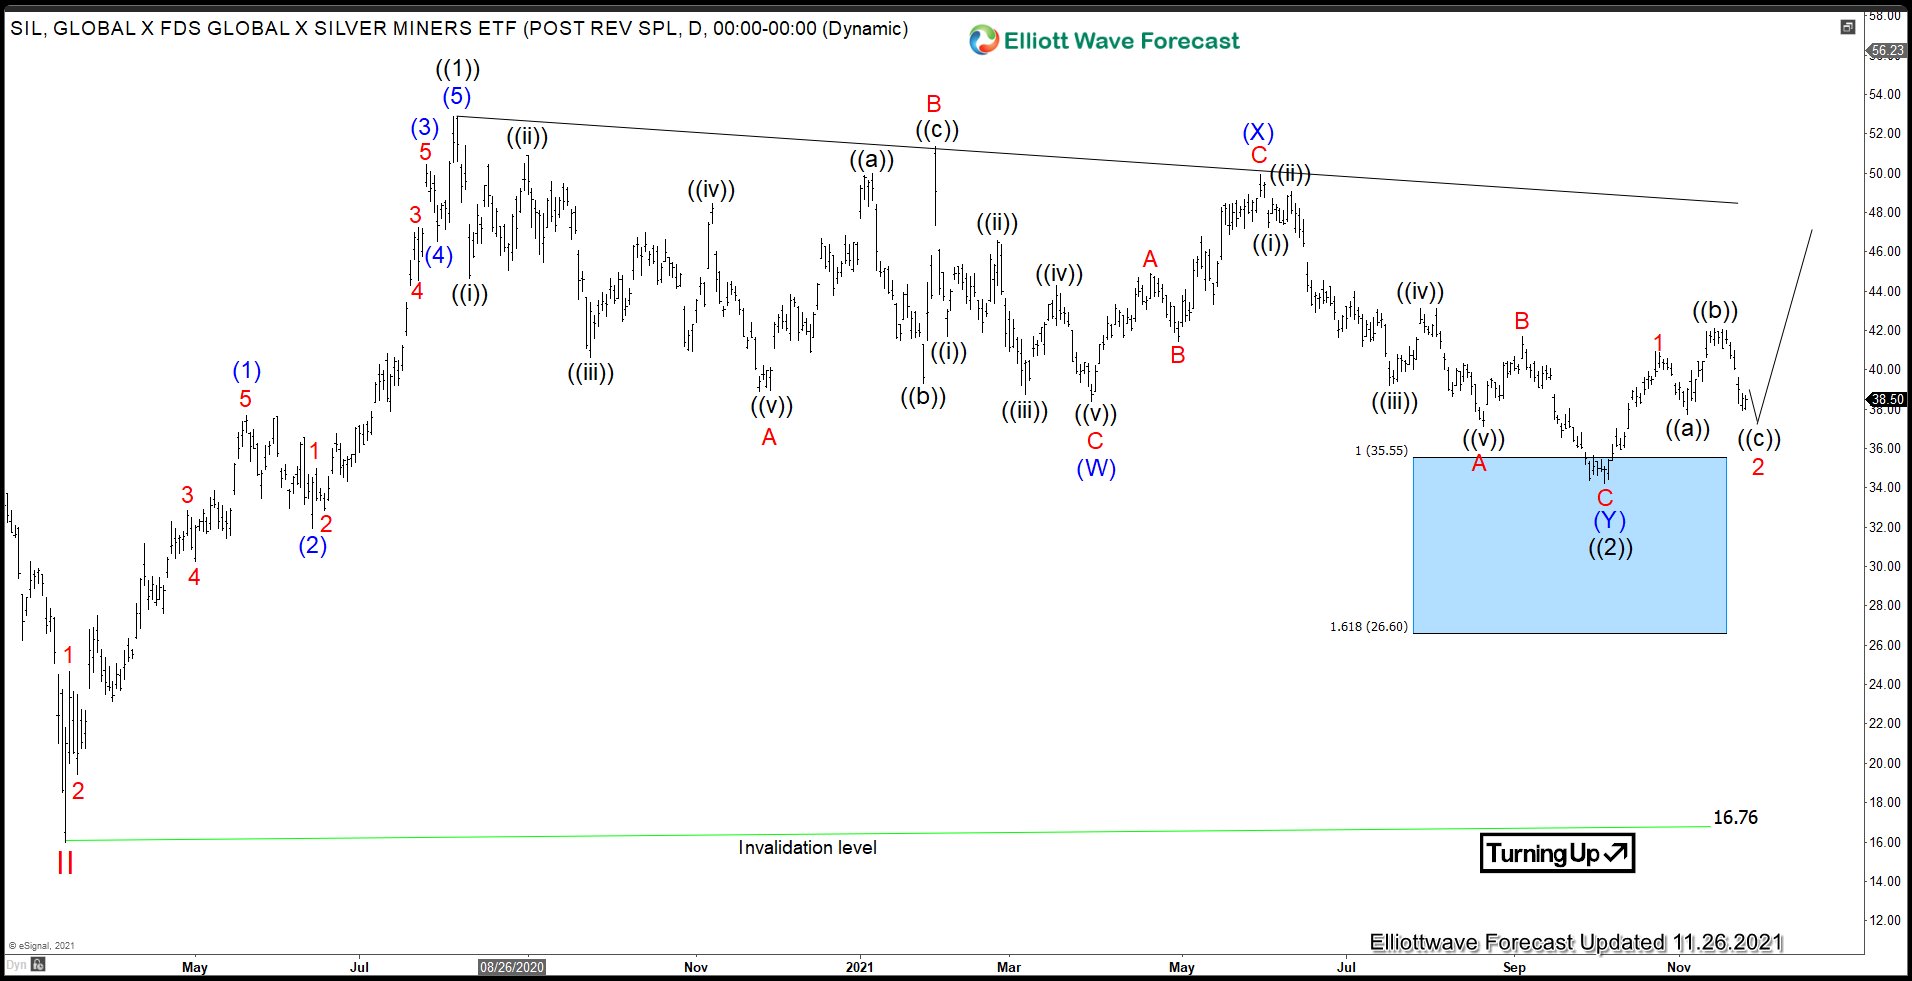
SIL Daily Elliott Wave Chart
After forming wave ((2)) low on October 5 inside the blue box, the ETF has rallied in what looks like a 3 waves. It’s possible that SIL is doing an expanded Flat correction in wave 2. As long as the pullback stays above wave ((2)) low at 34.21, expect further upside. Alternatively, if it breaks below $34.21, we can count the entire decline from wave ((1)) as a Flat. In this scenario, the ETF can see 1 more push in wave 5 of ©. Either way, the daily invalidation level at $16.76 remains the key pivot and the ETF is expected to extend higher once the correction is over.
Source: Elliott Wave Forecast: Silver Miners (SIL) Doing Flat Correction

