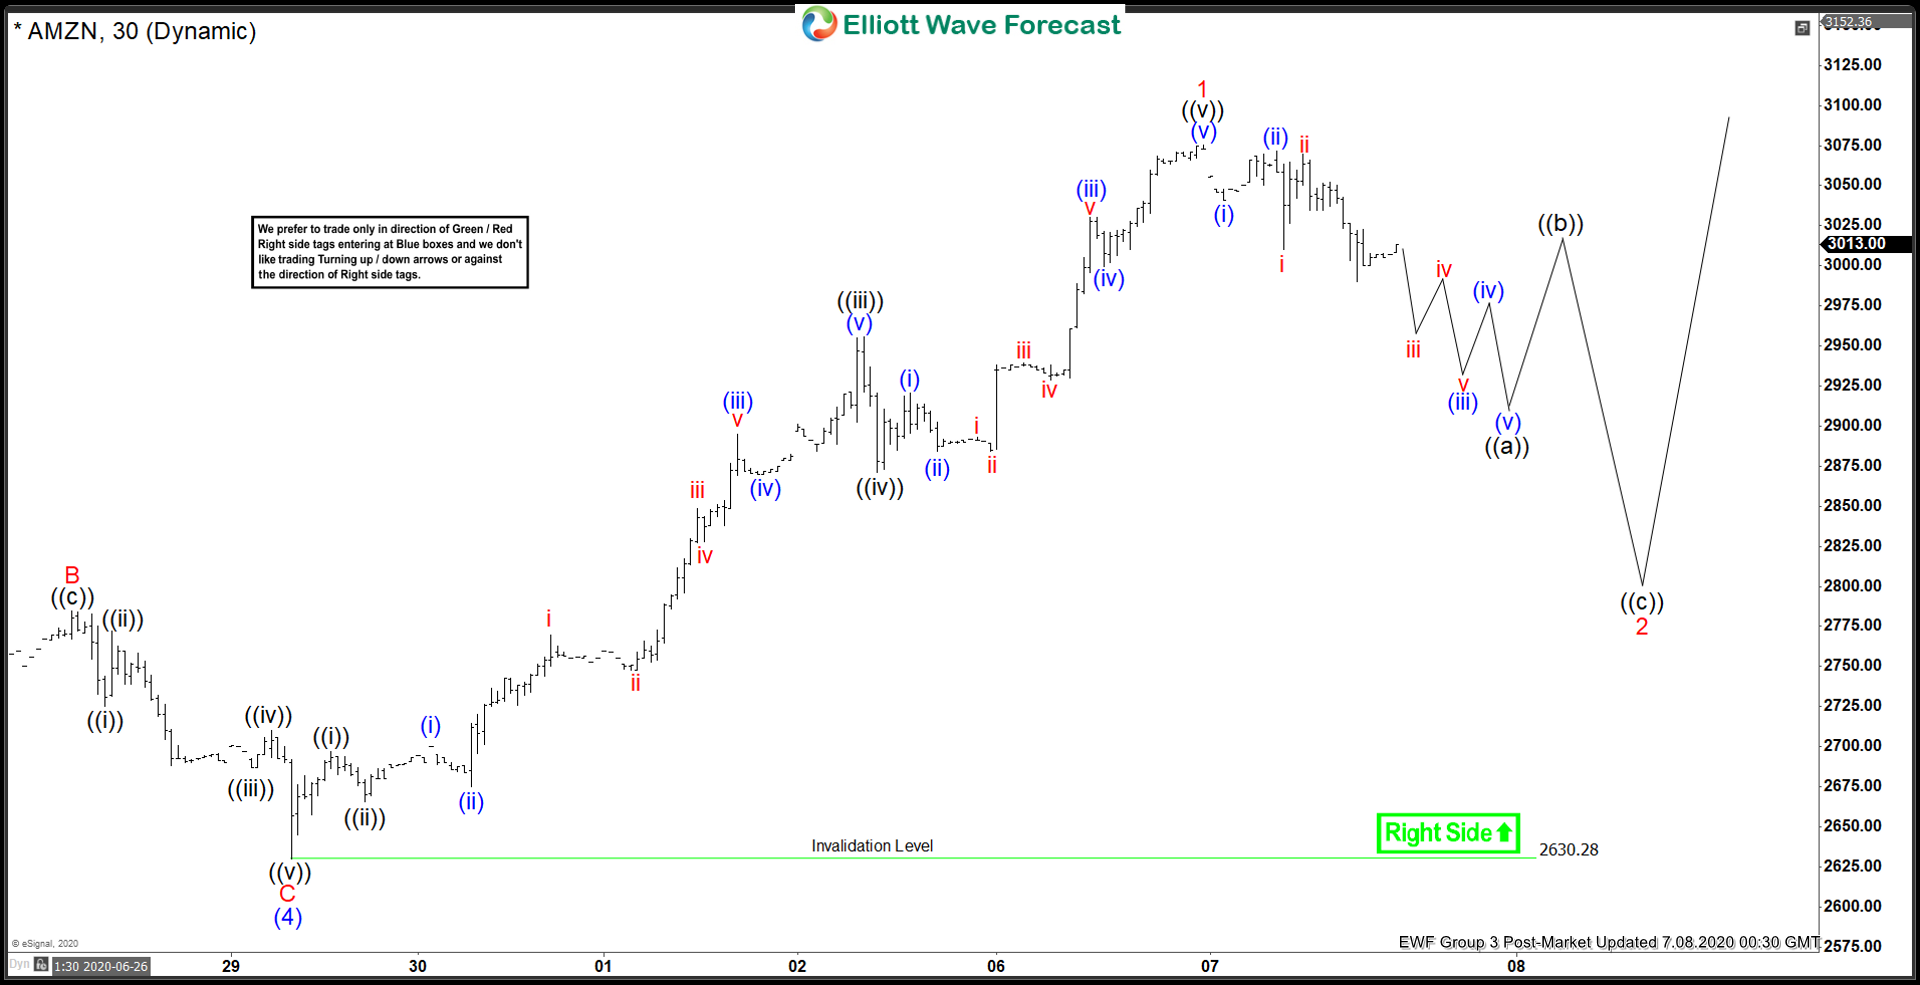
Amazon (AMZN) 30 minutes chart below shows that the stock has ended the cycle from June 29 low. The rally in wave 1 unfolded as a 5 waves Impulse Elliott Wave structure. Up from 2630.28 low, wave ((i)) ended at 2696.80 high. Wave ((ii)) dip ended at 2665.47 low. The pair then extended higher in wave ((iii)), which ended at 2955.56 high. The internal subwave of wave ((iii)) also unfolded as 5 waves impulse Elliott Wave structure in lesser degree. Afterwards, the pullback in wave ((iv)) ended at 2871.10 low. From there, the pair pushed higher in wave ((v)), which ended at 3075.55 high. This final move completed wave 1 in higher degree and ended cycle from June 29 low.
The pair is currently doing a pullback in wave 2 to correct the cycle from June 23 low. The correction could unfold as a zig-zag structure. While above 2630.28 low, expect the dips to find support in 3,7, or 11 swings for more upside. The alternate count for AMZN would be that the stock has already ended wave (5) in its entirety instead of just wave 1 of (5). If this is the case, then the stock could have ended the cycle from March low. AMZN then could be doing a larger degree pullback to correct the cycle from March low before upside resume again.
Amazon (AMZN) 30 Minutes Elliott Wave Chart