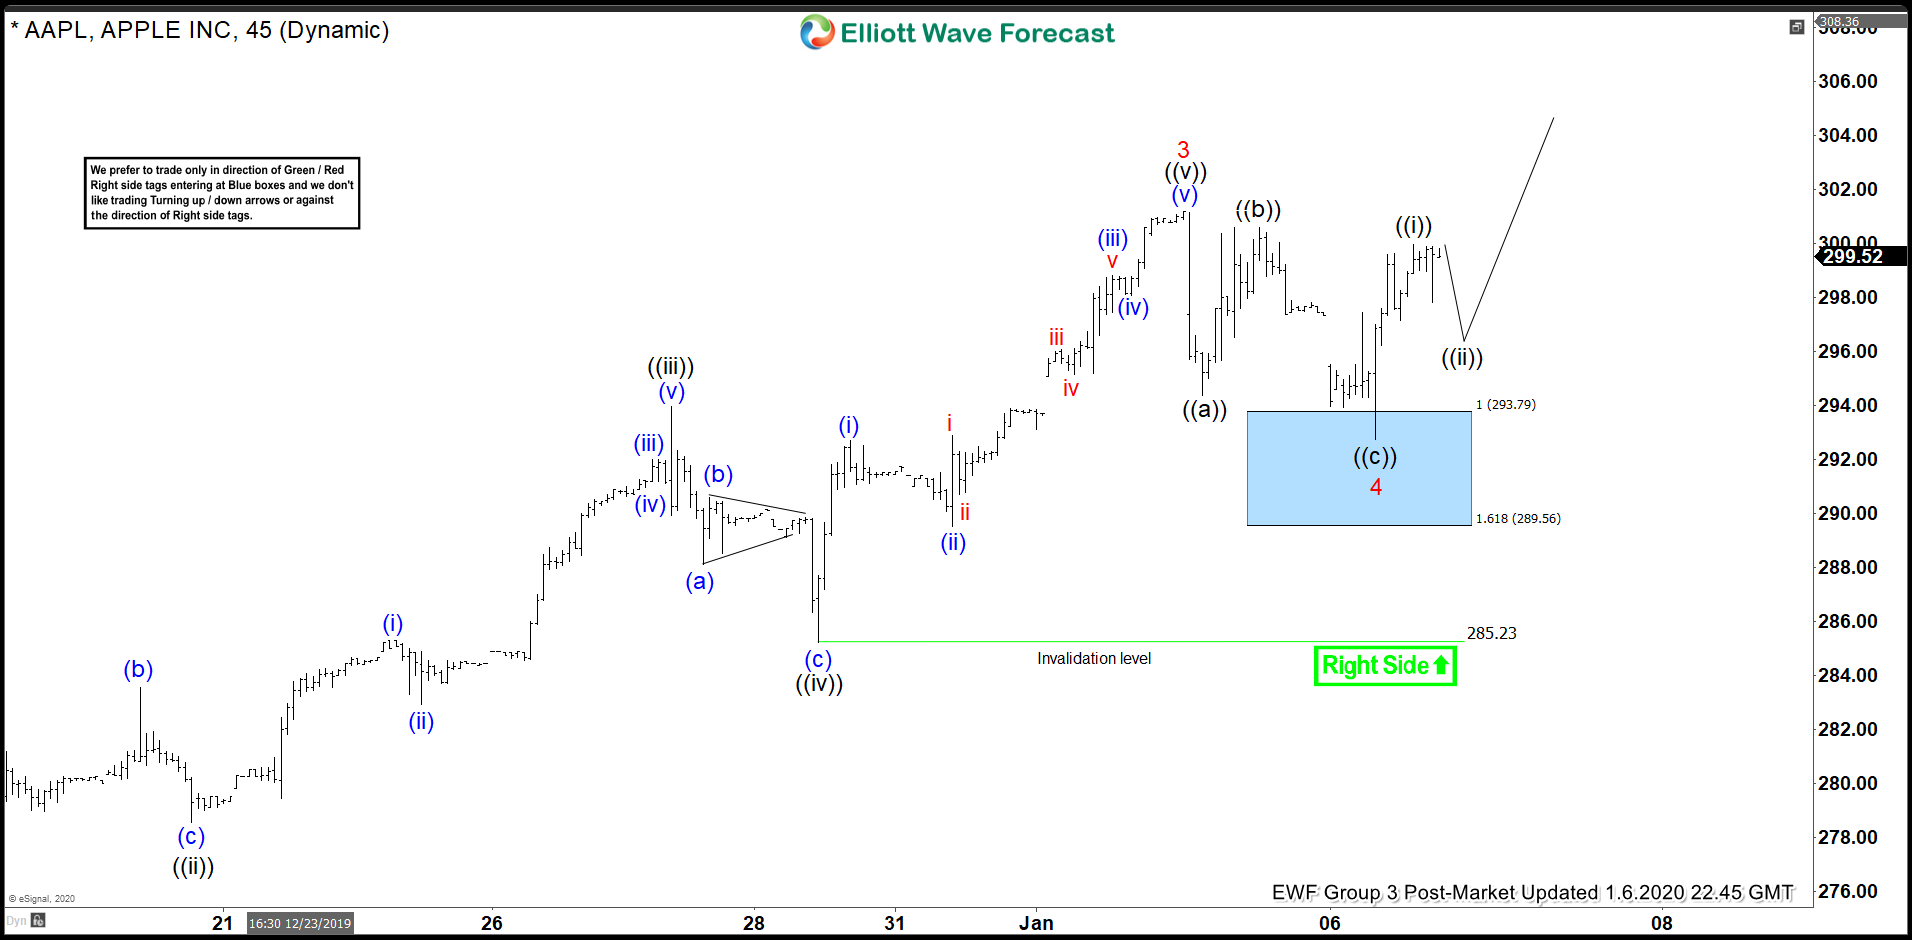
Elliott Wave view on Apple (ticker: AAPL) suggests the cycle from June 3, 2019 low remains bullish and the rally is unfolding as an impulsive Elliott Wave structure. On the 1 hour chart below, the rally to $301.19 on January 3, 2020 high ended wave 3. Pullback to $292.75 has ended wave 4 in 3 waves zigzag at the blue box area and the stock has resumed higher in wave 5. The stock still needs to break above $301.19 to rule out a double correction. Near term, while pullback stays above $292.75, and more importantly above $285.23, expect stock to extend higher within wave 5.
In the alternate scenario, wave 5 might be complete already at $301.19 and cycle from August 8, 2019 low is over. In this case, stock can see a larger pullback to correct cycle from August 8 low in 3, 7, or 11 swing. However, even if this scenario plays out, the larger degree bullish trend still remains intact and pullback still should see buyers in the sequence of 3 , 7, or 11 swing for more upside. We do not like selling the stock.
Apple (AAPL) 1 Hour Elliott Wave Chart