ASANA Inc. (ASAN), operates a work management platform as Software services globally to get work done faster, while enhancing employee engagement by connecting to the mission of organization. It headquartered in San Francisco, California. It trades under the ticker name “ASAN” at NYSE & comes under Technology - Software application sector.
ASAN Daily Elliott Wave Analysis
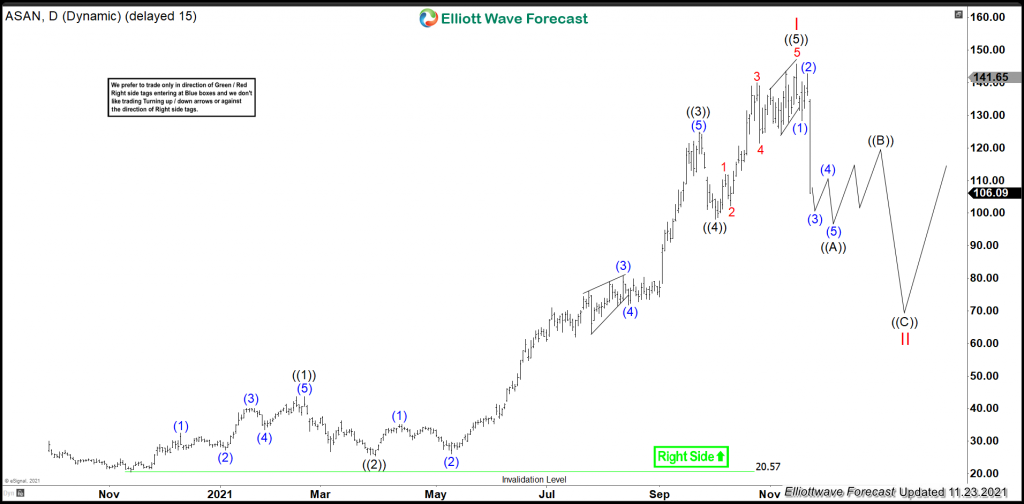
ASAN made an impulse sequence higher as I red started from $20.57 low dated 11/12/2020, which proposed ended at $145.79 high on 11/15/2021. Thereafter the reaction lower was too sharp, which favors further weakness in correction of II before it resumes the next upside.
In daily, the all time low was at $20.57 on 11/12/2020. While above there it favored ended ((1)) at $43.72 high on 02/19/2021, while below there it placed ((2)) at $25.41 low on 03/30/2021. The correction of ((2)) was quite dip as 0.764 retracement against previous cycle. The wave ((3)) wave favored ended at $124.85 high on 9/23/2021 as third wave extension within third wave extension. The wave ((4)) favored ended at $98.06 low on 10/01/2021 low as shallow correction as 0.236 retracement of ((3)). The final leg higher favored ended at $145.79 high on 11/15/2021. While below there it favors the correction of II red lower.
Yesterday it dropped around 22%, which calls for short term weakness. In shorter cycle, it favors the (3) of ((A)) in progress & expect one more leg lower before it bounce in (4) followed by new low of (5) of ((A)). Thereafter it expects the bounce in ((B)) leg before further downside resumes towards equal leg area to end (©) of II.
