Bank of America (ticker: BAC) shows an Elliott Wave bullish sequence from August 15, 2019 low, favoring further upside. The decline to 27.19 ended wave (2) and the stock has resumed higher in wave (3). The internal of wave (3) is unfolding as a 5 waves impulse Elliott Wave structure where wave 1 of (3) is expected to complete soon.
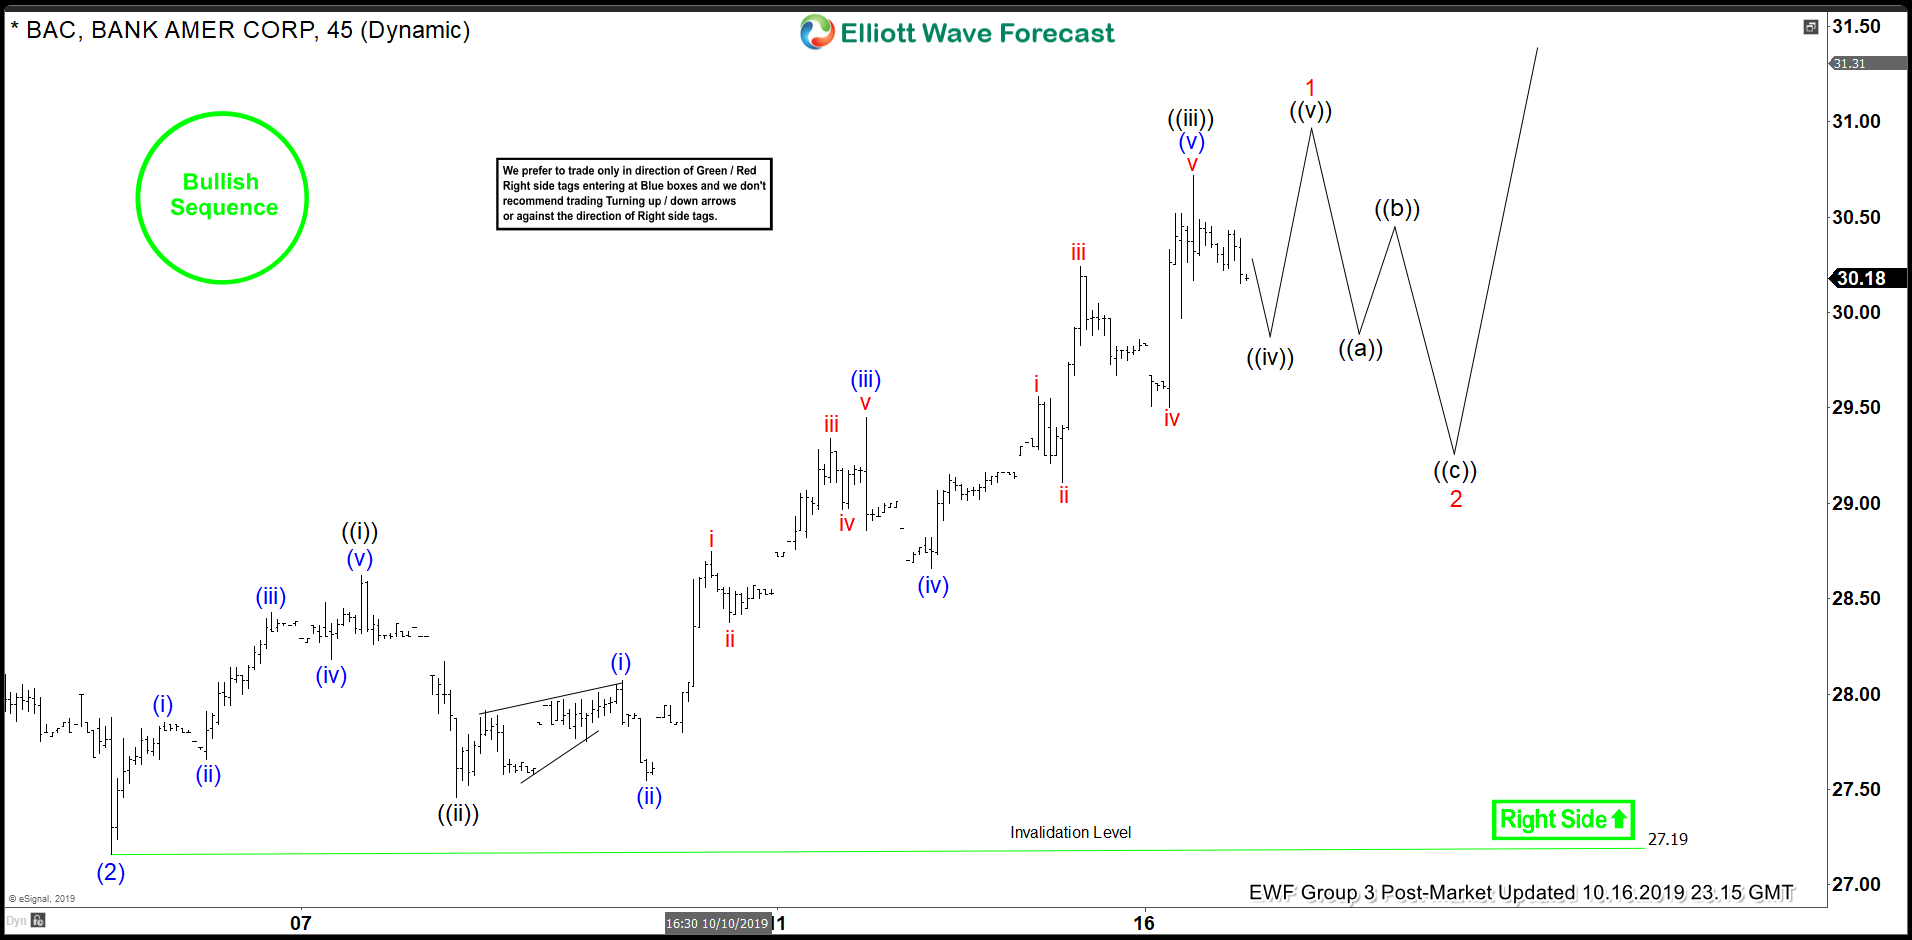
Up from 27.19 low, wave ((i)) ended at 28.62, wave ((ii)) ended at 27.46, and wave ((iii)) ended at 30.72. Expect the stock to pullback in wave ((iv)) and turns higher 1 more time in wave ((v)). The 5 waves move higher should end wave 1 of (3). The stock should then pullback in wave 2 to correct cycle from October 3 low (27.19) before the rally resumes again.
We don’t like selling the proposed pullback as it’s against the direction of right side tag. As far as pivot at 27.19 low stays intact, expect dips to find support in the sequence of 3, 7, or 11 swing for further upside. Potential target to the upside is 100% Fibonacci extension from August 15, 2019 low towards $31.2 - $32.2.
BAC 1 Hour Elliott Wave Chart