Elliott wave view in Exxon Mobil (ticker: XOM) suggests that the sequence from April 23, 2019 high (not visible in the short term chart below) is incomplete. Medium term downside target for the stock is 100% - 123.6% Fibonacci extension from April 23, 2019 high which comes at 52 - 56.1. XOM thus remains favored to the downside and rally should fail in 3, 7, or 11 swing. Shorter cycle, the decline from January 3, 2020 high is in progress as a 5 waves impulse and the stock is currently within final wave ((v)) of the move lower.
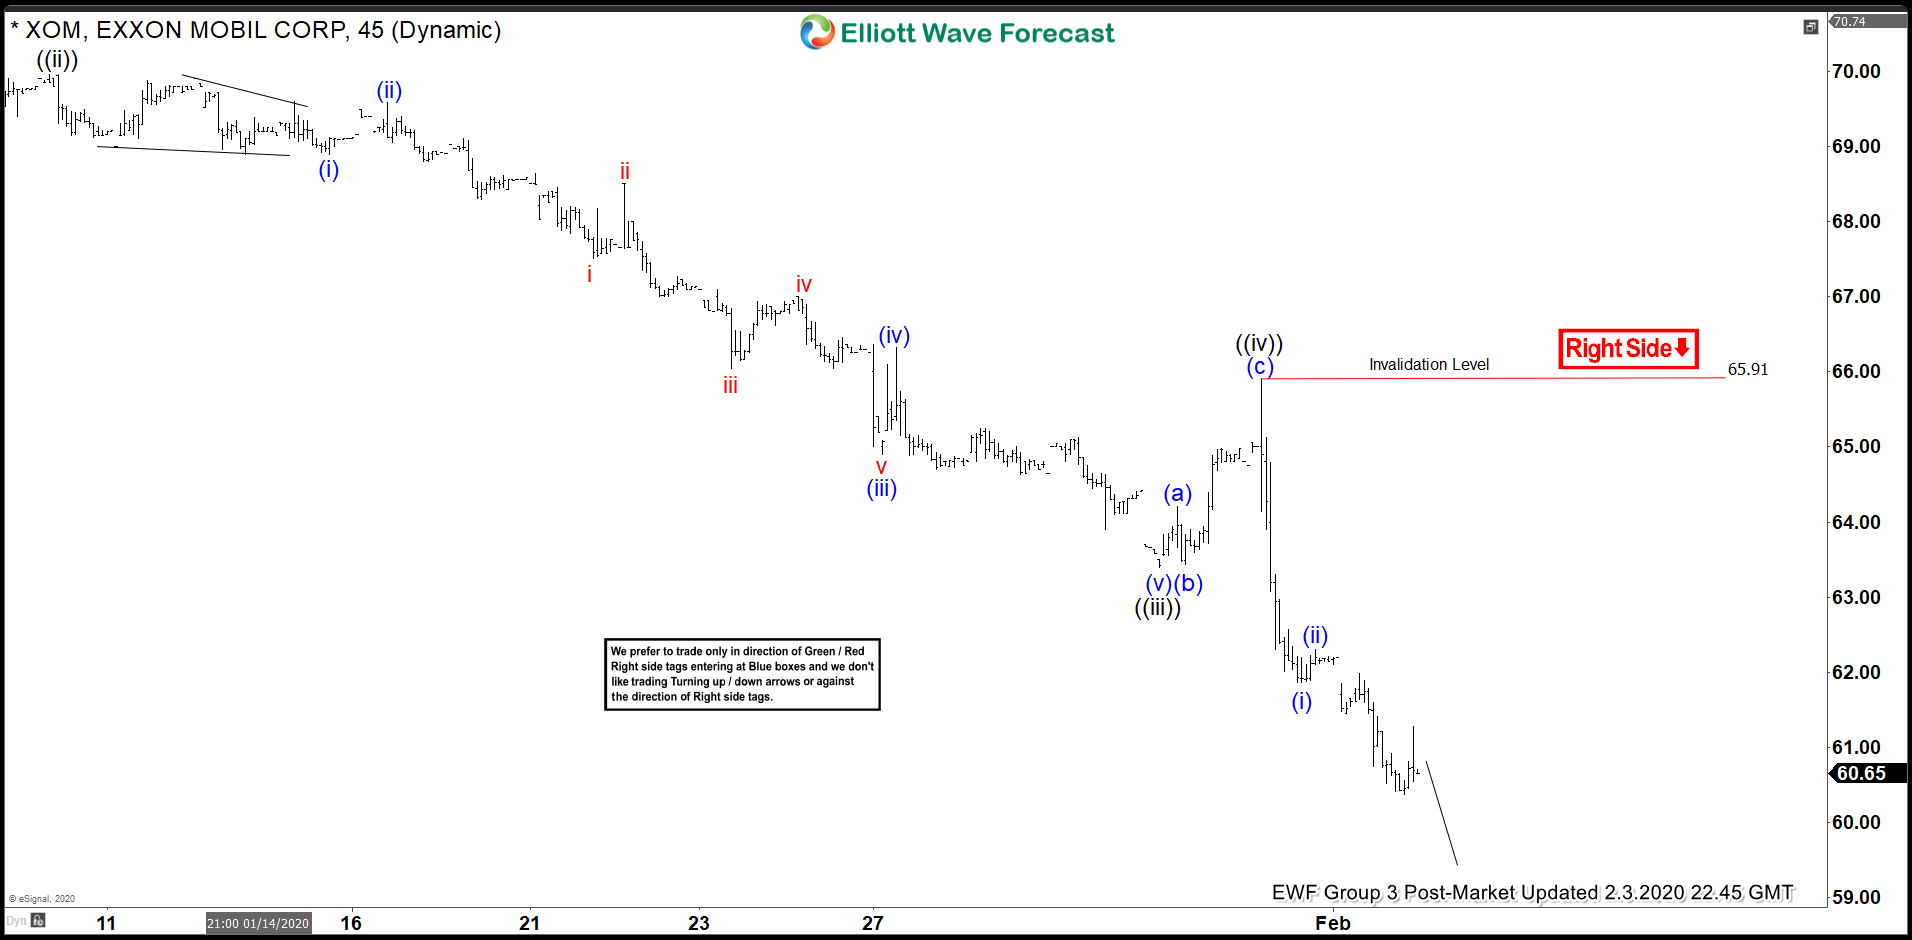
Down from January 3, 2020 high (71.37), wave ((i)) ended at 68.63 and wave ((ii)) bounce ended at 69.96. The stock has resumed lower and ended wave ((iii)) at 63.4 and bounce in wave ((iv)) ended at 65.87. Exxon Mobil is in the final leg wave ((v)) lower thus it is a little risky to chase the weakness in the shorter cycle. Near term, as far as the bounce fails below 65.87, further downside still can’t be ruled out before XOM ends the 5 waves down.
The 5 waves move down should end wave 3 in larger degree and the stock should then bounce in wave 4 to correct the cycle from January 3, 2020 high before the decline resumes again. We don’t like buying the stock.
Exxon Mobil 1 Hour Elliott Wave Chart