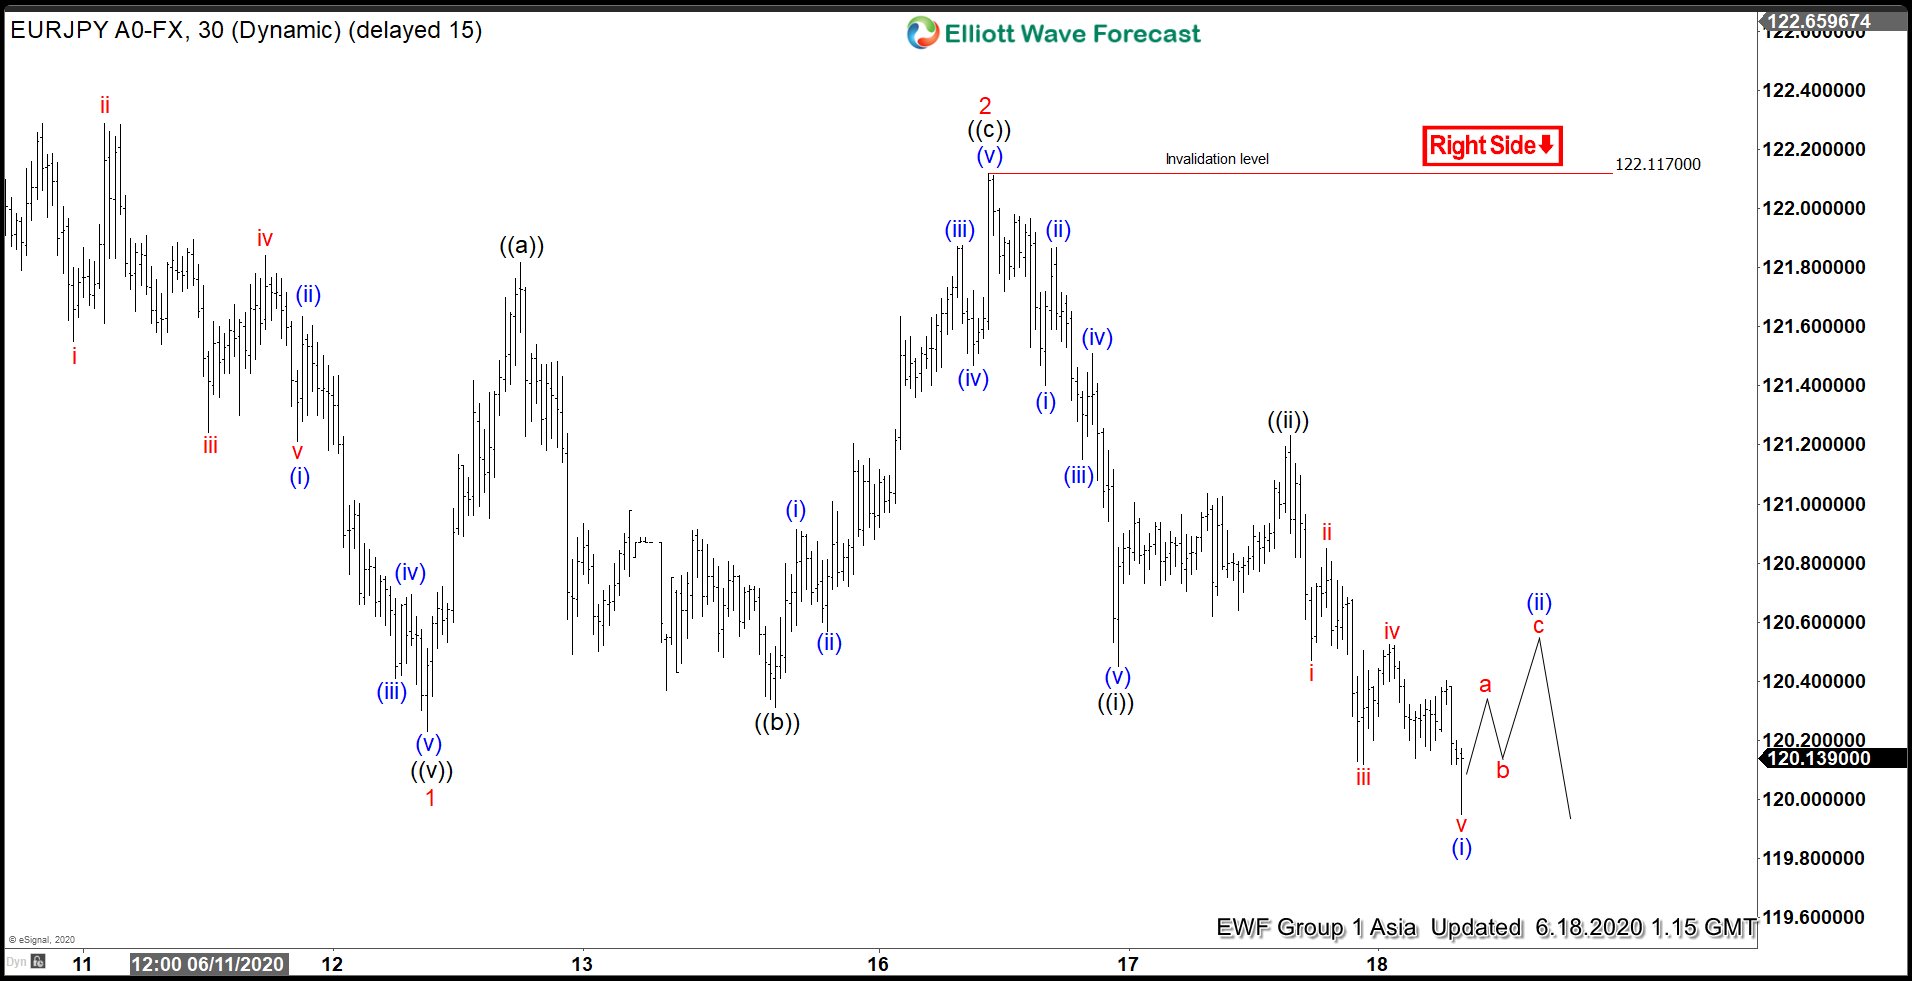
Elliott Wave View in EURJPY suggests the decline from 6.1.2020 high is unfolding as a 5 waves impulse Elliott Wave structure. Down from 6.1.2020 high, wave 1 ended at 120.23 as an impulse. Afterwards, the bounce in wave 2 ended at 122.11 as a zigzag. Up from wave 1 low, wave ((a)) ended at 121.81 and wave ((b)) pullback ended at 120.31. The pair then extended higher in wave (©), which ended at 122.11. The pair then resumes lower in wave 3 as another 5 waves impulse in lesser degree.
Down from wave 2 high, wave (i) ended at 121.4, and bounce in wave (ii) ended at 121.867. Pair resumes lower in wave (iii) towards 121.15 and wave (iv) bounce ended at 121.508. Final leg wave (v) ended at 120.45 and this completed wave ((i)). Pair then bounced in wave ((ii)) and ended at 121.23. Currently, wave ((iii)) is in progress as an impulse where wave (i) of ((iii)) ended at 119.8. Near term, while bounce in wave (ii) of ((iii)) stays below 121.23, and more importantly below 122.11, expect pair to extend lower again. As far as pivot at 122.11 high stays intact, expect rally in EURJPY to fail in the sequence of 3 ,7, or 11 swing for further downside.
EURJPY 1 Hour Elliott Wave Chart