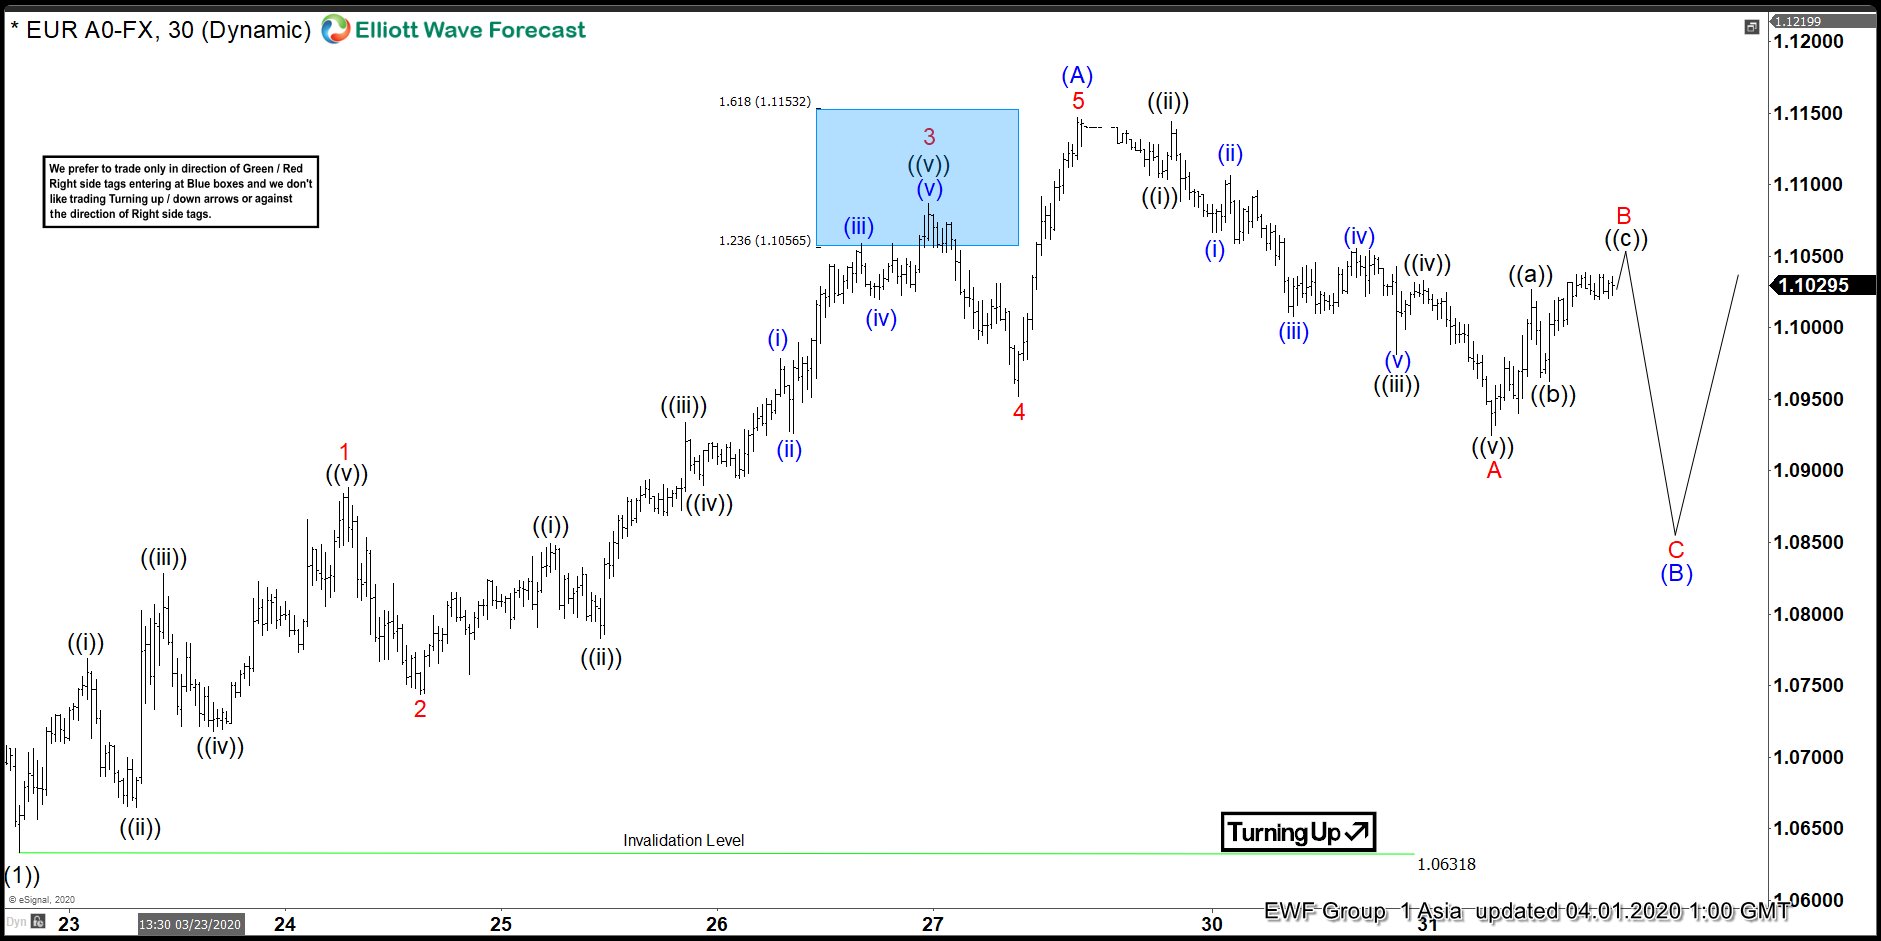
EURUSD shows an incomplete sequence from Feb 16, 2018 high favoring further downside while below March 9 high (1.1496). Near term, the decline from March 9, 2020 high (1.1496) ended wave ((1)). Bounce in wave ((2)) is unfolding as a zigzag Elliott Wave structure where wave (A) ended at 1.1147. Internal of wave (A) unfolded as a 5 waves impulse. Up from March 23 low (1.063), wave 1 of (A) ended at 1.088 and pullback in wave 2 of (A) ended at 1.074. Pair resumes higher in wave 3 of (A) towards 1.1086, and wave 4 of (A) pullback ended at 1.0952. Final leg wave 5 of (A) ended at 1.1147.
Wave (B) pullback remains in progress as a zigzag where wave A ended at 1.092. as 5 waves. Down from 1.1147, wave ((i)) of A ended at 1.1103, and wave ((ii)) of A ended at 1.114. Wave ((iii)) of A ended at 1.098 and wave ((iv)) of A bounce ended at 1.103. Final leg wave ((v)) of A ended at 1.092. While wave B bounce fails below 1.1147, expect pair to extend lower in wave C of (B) before turning higher again in wave ©. As far as the pullback stays above 1.063, expect pair to extend higher to continue the rally to correct cycle from March 9, 2020 high.
