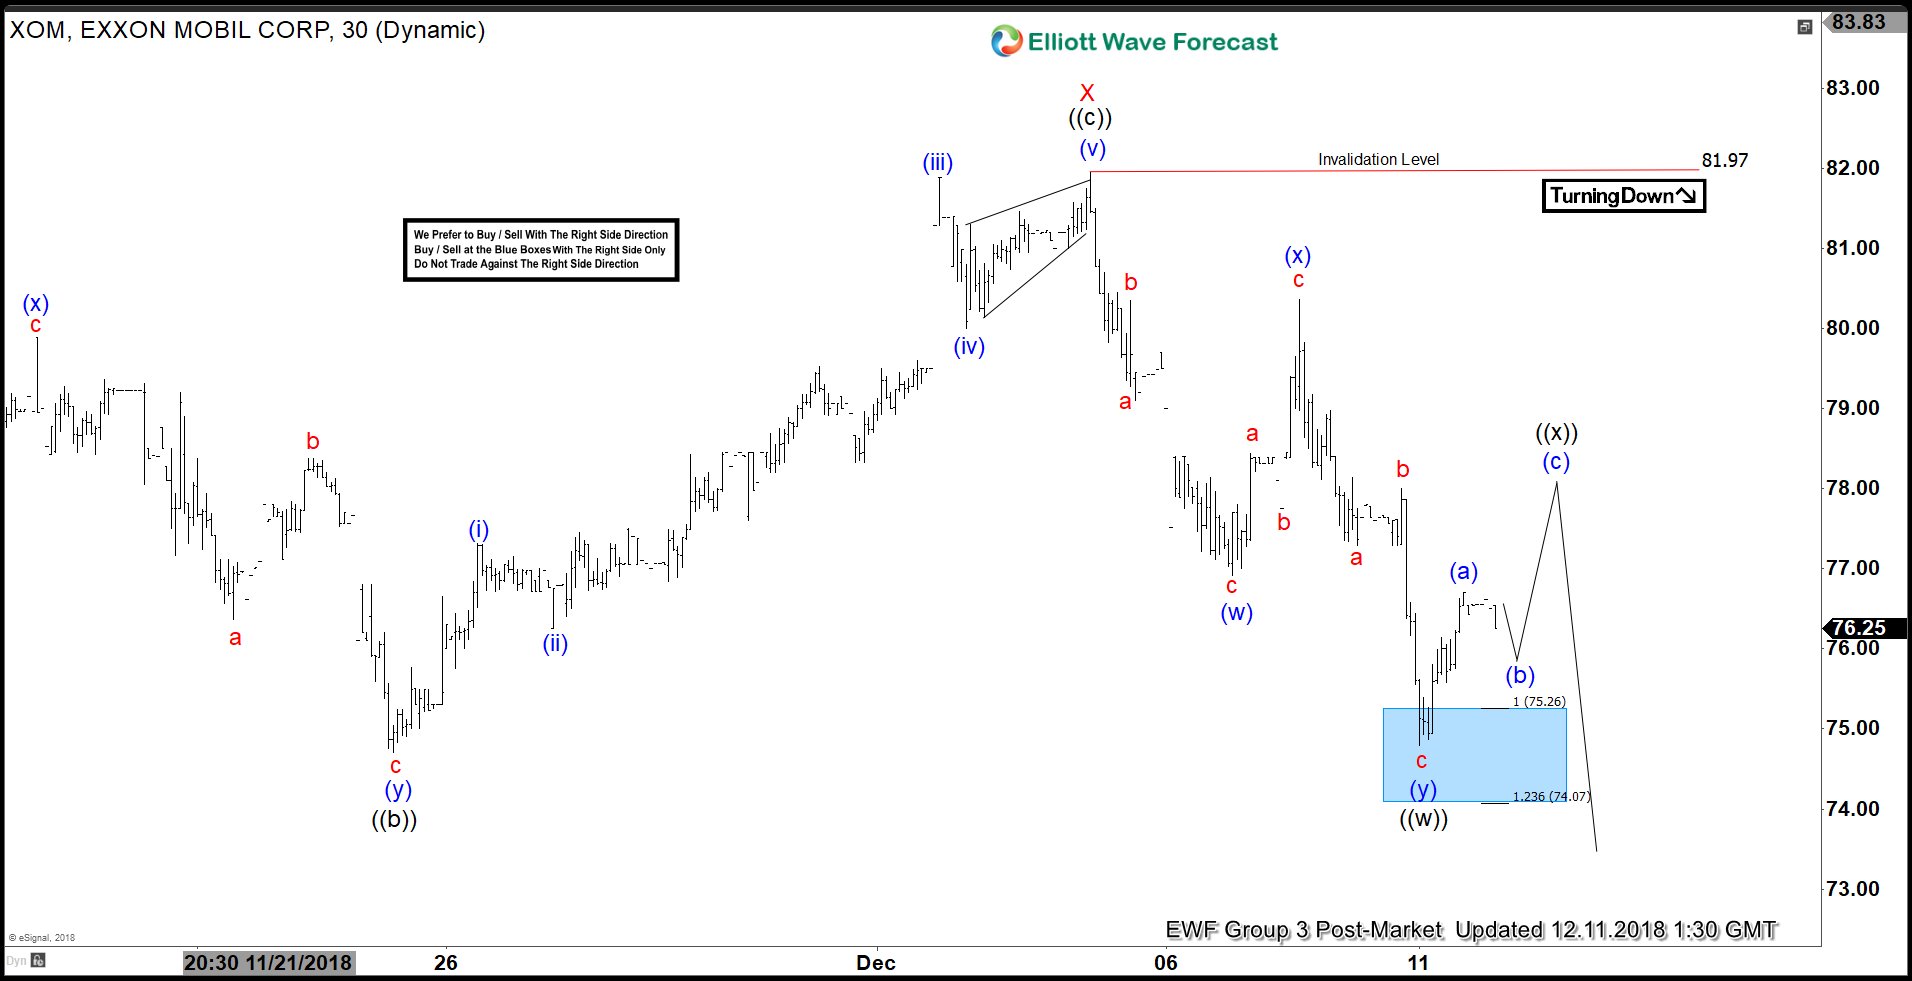
Exxon Mobil (ticker: XOM) has broken below Nov 23 low ($74.7) and opens further downside in the stock with incomplete sequence from Sept 25 high ($87.36). Short Term Elliott Wave view suggests bounce to $81.97 on 12/5 high ended Minor wave X. Decline from there is unfolding as a double three Elliott Wave structure where Minute wave ((w)) ended at $74.8. Internal of wave ((w)) unfolded as another double three Elliott Wave structure of a lesser degree. Minutte wave (w) of ((w)) ended at $76.92, Minutte wave (x) of ((w)) ended at $80.36, and Minutte wave (y) of ((w)) ended at $74.80.
Minute wave ((x)) is in progress to correct cycle from 12/5 high as a zigzag Elliott Wave structure where Minutte wave (a) of ((x)) ended at $76.7. Expect a pullback in Minutte wave (b) and another leg higher to complete Minutte wave © of ((x)) and end the zigzag pattern before the stock resumes lower. We expect sellers to appear and rally to fail below $81.97 in 3-7-11 swing for more downside in the stock.
XOM 1 Hour Elliott Wave Chart
