Franco Nevada (ticker: FNV) is a Canada-based company that own royalties and streams in gold mining and other commodity and natural resource investments. The company does not operate mines, develop projects, or conduct explorations. The entire business model of the company focuses on managing the royalties and streams. Shares of the company have rallied > 60% year to date compared to the industry’s growth of 45.5% and S&P 500’s gain of 6.8%.
One of the advantages of the company’s business models is the portfolio diversification. While some of the Franco Nevada’s mining operators need to shutdown due to coronavirus pandemic, some other mines continue to operate normally , which helps negates the overall negative impact. As of March 13, 2020, the company has available cash of $1.5 billion, thus it’s financially strong to survive in the current tough business environment. With Gold’s price projected to continue higher due to economic uncertainties and unprecedented money printing, the company should continue to outperform.
Franco Nevada (FNV) Monthly Elliott Wave Chart
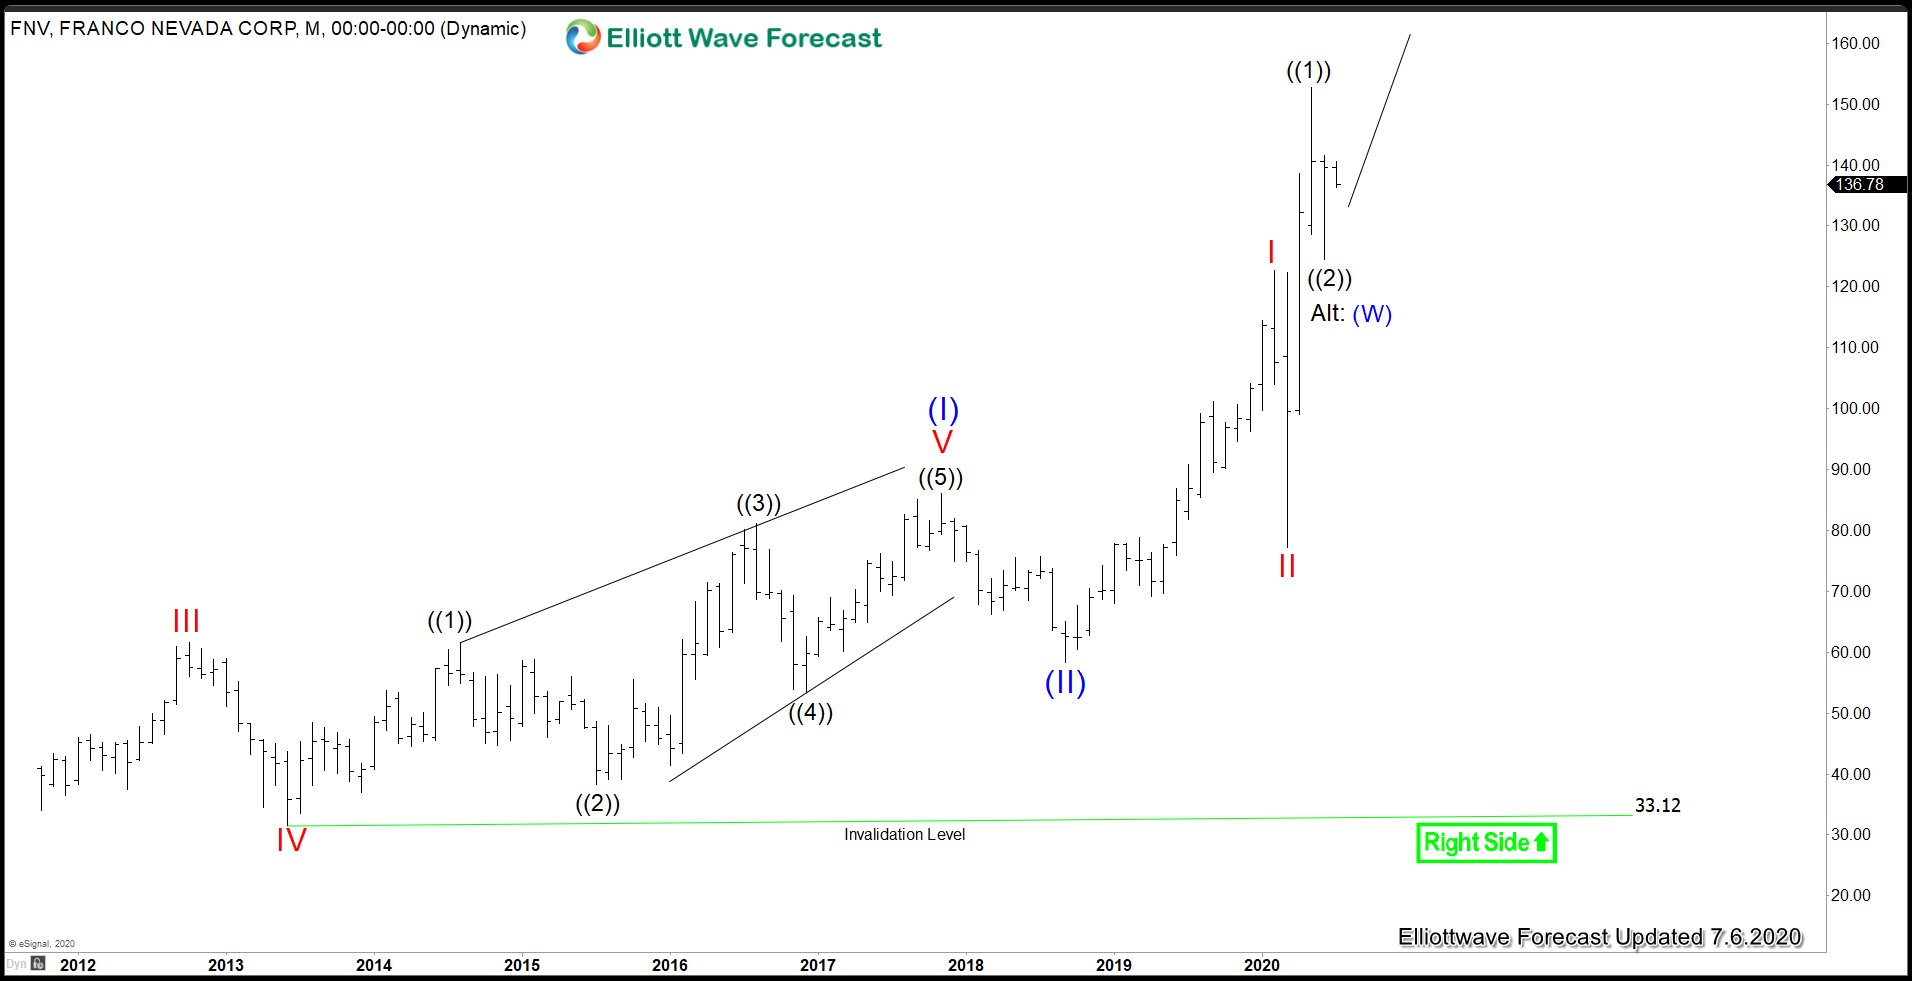
Monthly chart of Franco Nevada (FNV) above shows the rally from all-time low is unfolding as a 5 waves impulse Elliott Wave structure favoring further upside. The rally to $86.06 on November 2017 is proposed to end wave (I). The pullback to $58.26 ended wave (II). The stock is now nesting within wave (III) with subdivision as multiple impulse in lesser degree. Up from wave (II) low, wave I ended at $122.65, and pullback to $77.18 ended wave II. Stock then resumes higher again. Expect dips to continue to find buyers in 3 ,7, or 11 swing going forward.
FNV Daily Elliott Wave Chart
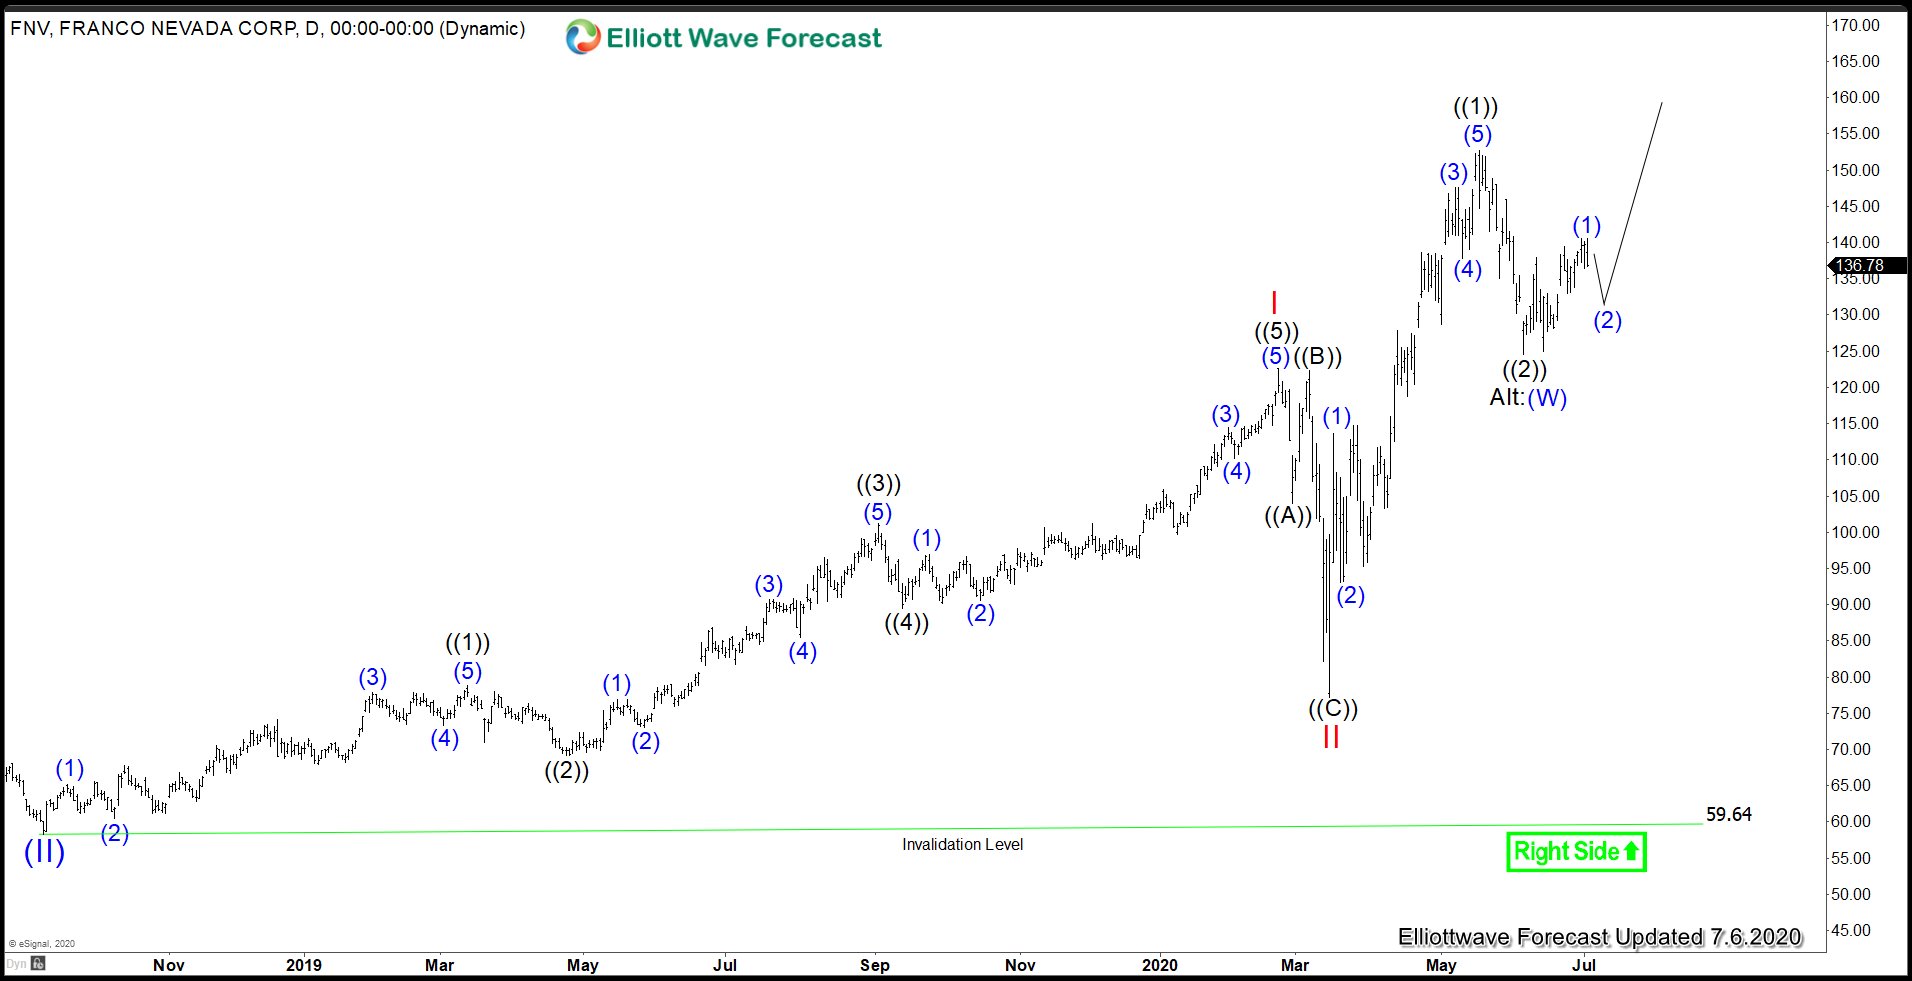
Daily Elliott wave chart above shows FNV is now within wave (III) as a nest. Up from $59.64, wave I ended at $122.65 and wave II pullback ended at $104. Stock then resumed higher and ended wave ((1)) at $152.70 and pullback in wave ((2)) ended at $124.51. While dips stay above $124.51, and more importantly above $104, expect the stock to continue higher.
FNV 4 Hour Elliott Wave Chart
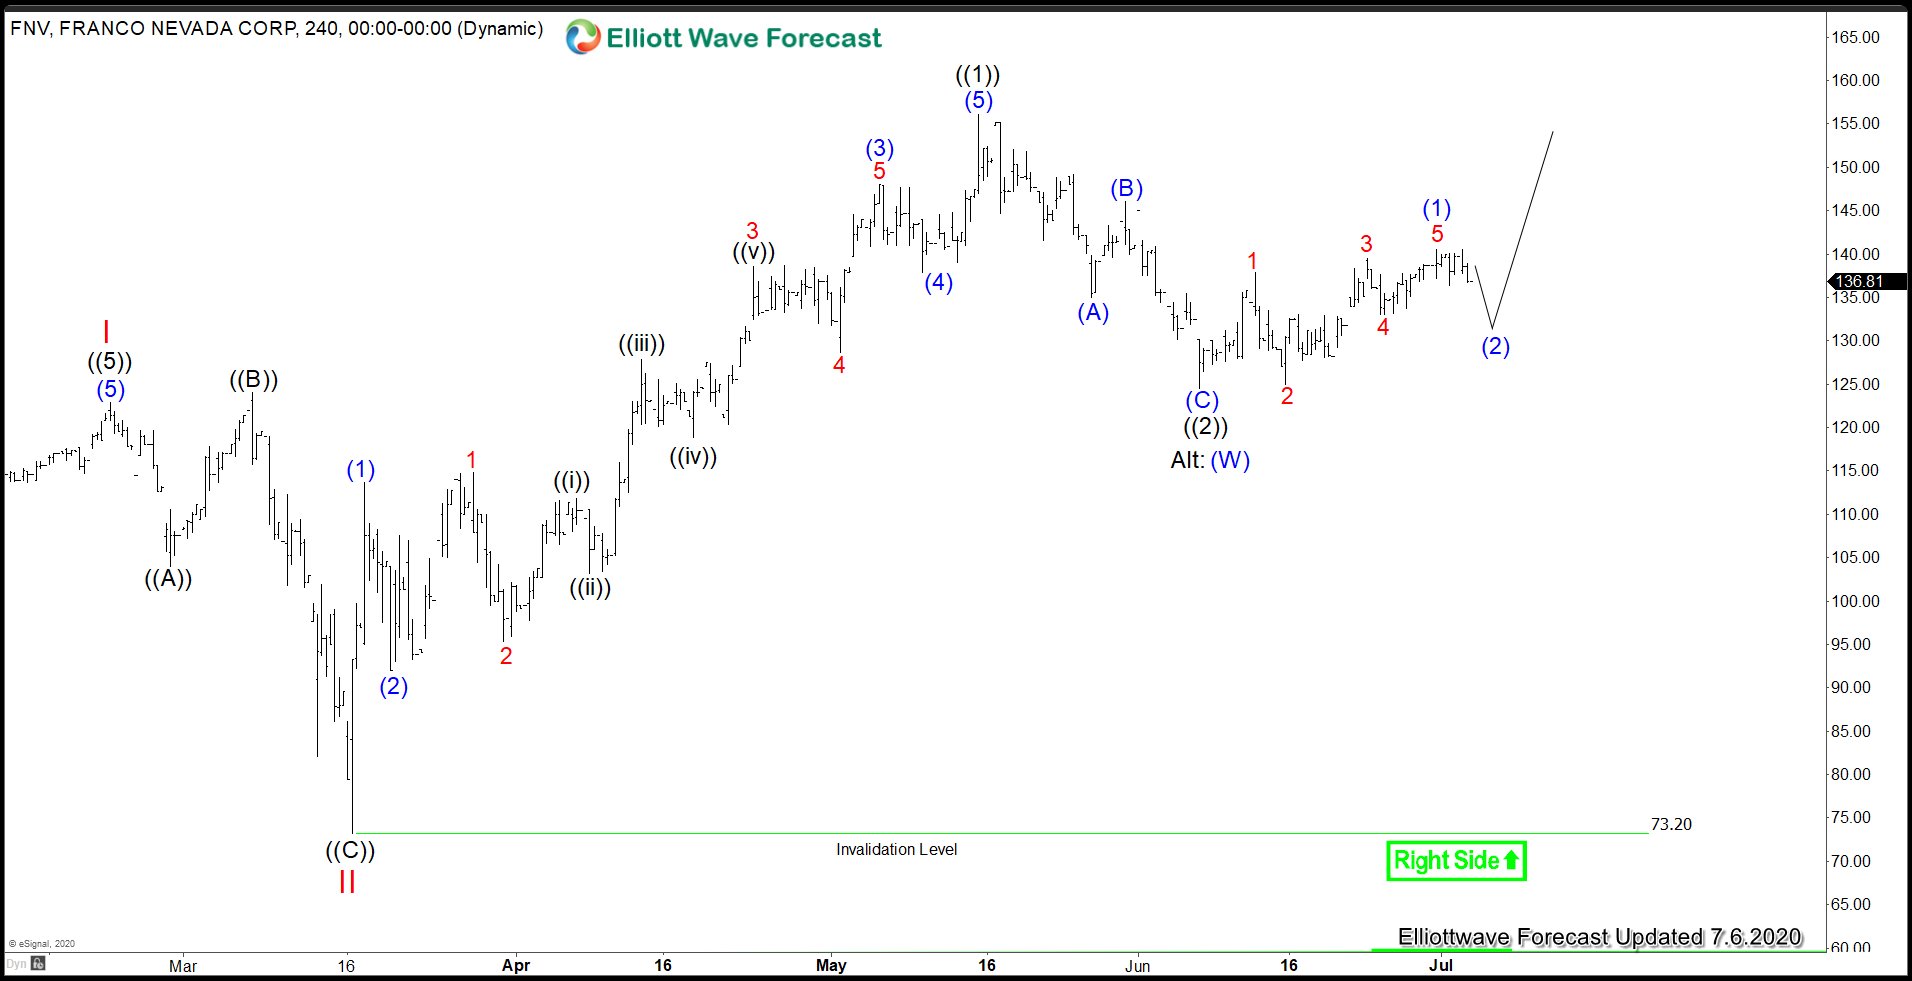
4 hour chart of FNV above suggests the stock is rallying within wave III. Subdivision of wave III is unfolding as an impulse where wave ((1)) ended at $152.70 and pullback in wave ((2)) is proposed to end at $124.51. The stock still needs to break above wave ((1)) at $152.70 to rule out a double correction in wave ((2)). Alternatively, pullback to $124.51 ended wave (W). The current short term bounce is wave (X), then stock does another leg lower to end wave (Y) of ((2)) before the rally resumes.