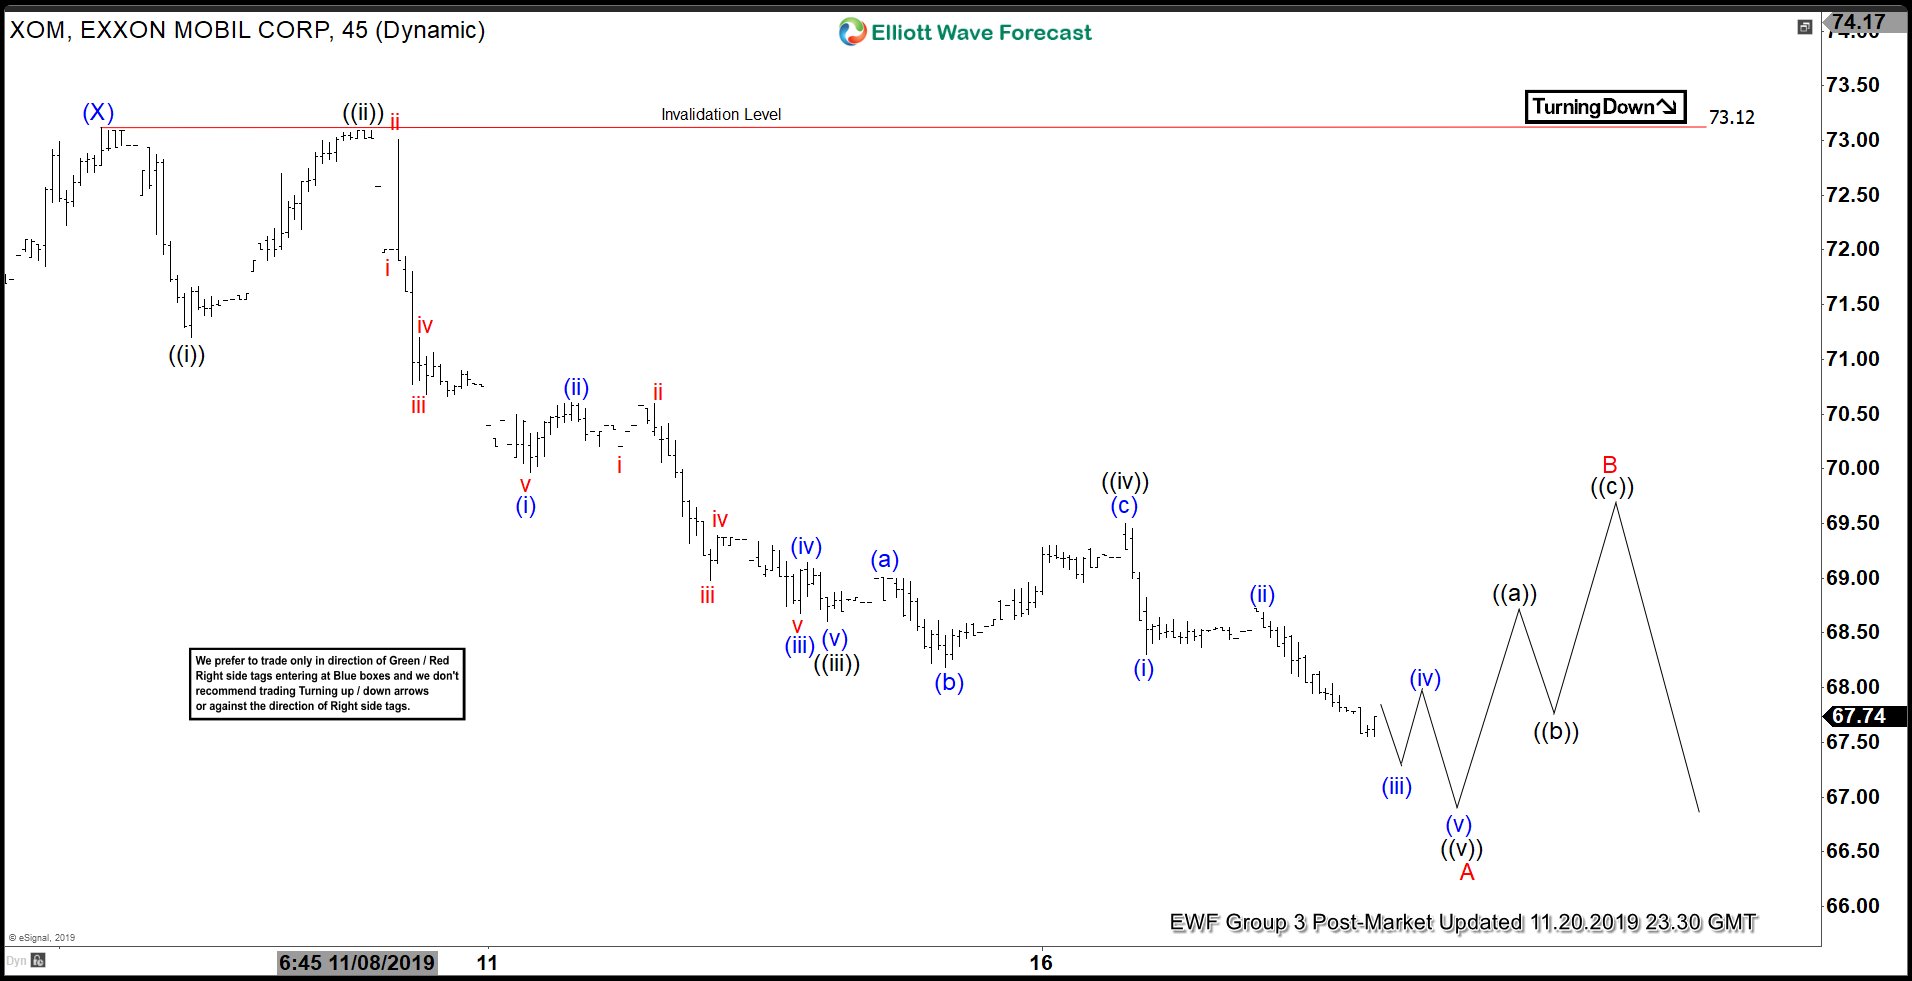
Exxon Mobil (ticker symbol: $XOM) shows an incomplete 5 swing Elliott Wave sequence from April 23, 2019 high favoring further downside. In the short term chart below, we can see the rally to $73.12 on November 6, 2019 ended wave (X). The stock then resumes lower. The structure of the decline from November 6 high is unfolding as a 5 waves impulse Elliott Wave structure. Down from Nov 6 high, wave ((i)) ended at 71.2 and wave ((ii)) rally ended at 73.09. The stock then continues lower in wave ((iii)) towards 68.6 with internal subdivided as an impulse in lesser degree. The bounce in wave ((iv)) ended at 69.50
Exxon Mobil is finishing wave ((v)) of A lower. The stock still can see 1 more marginal low to end the 5 waves down from November 6, 2019 high. Afterwards, the stock should bounce in wave B to correct cycle from November 6 high before the decline resumes. Potential target to the downside is 100% Fibonacci extension from September 16, 2019 high which comes at 62.27 - 64.35. As far as pivot at 73.12 high stays intact, expect rally in the stock to find sellers in the sequence of 3, 7, or 11 swing for further downside.
Exxon Mobil 1 Hour Elliott Wave Chart