We have highlighted the possibility that Gold can quickly retest the high in 2018. The chart below shows the yellow metal has broken above a long term bearish channel from Sept 5, 2011 high. In addition, it has successfully closed above the ascending trend support from December 3, 2015 low.
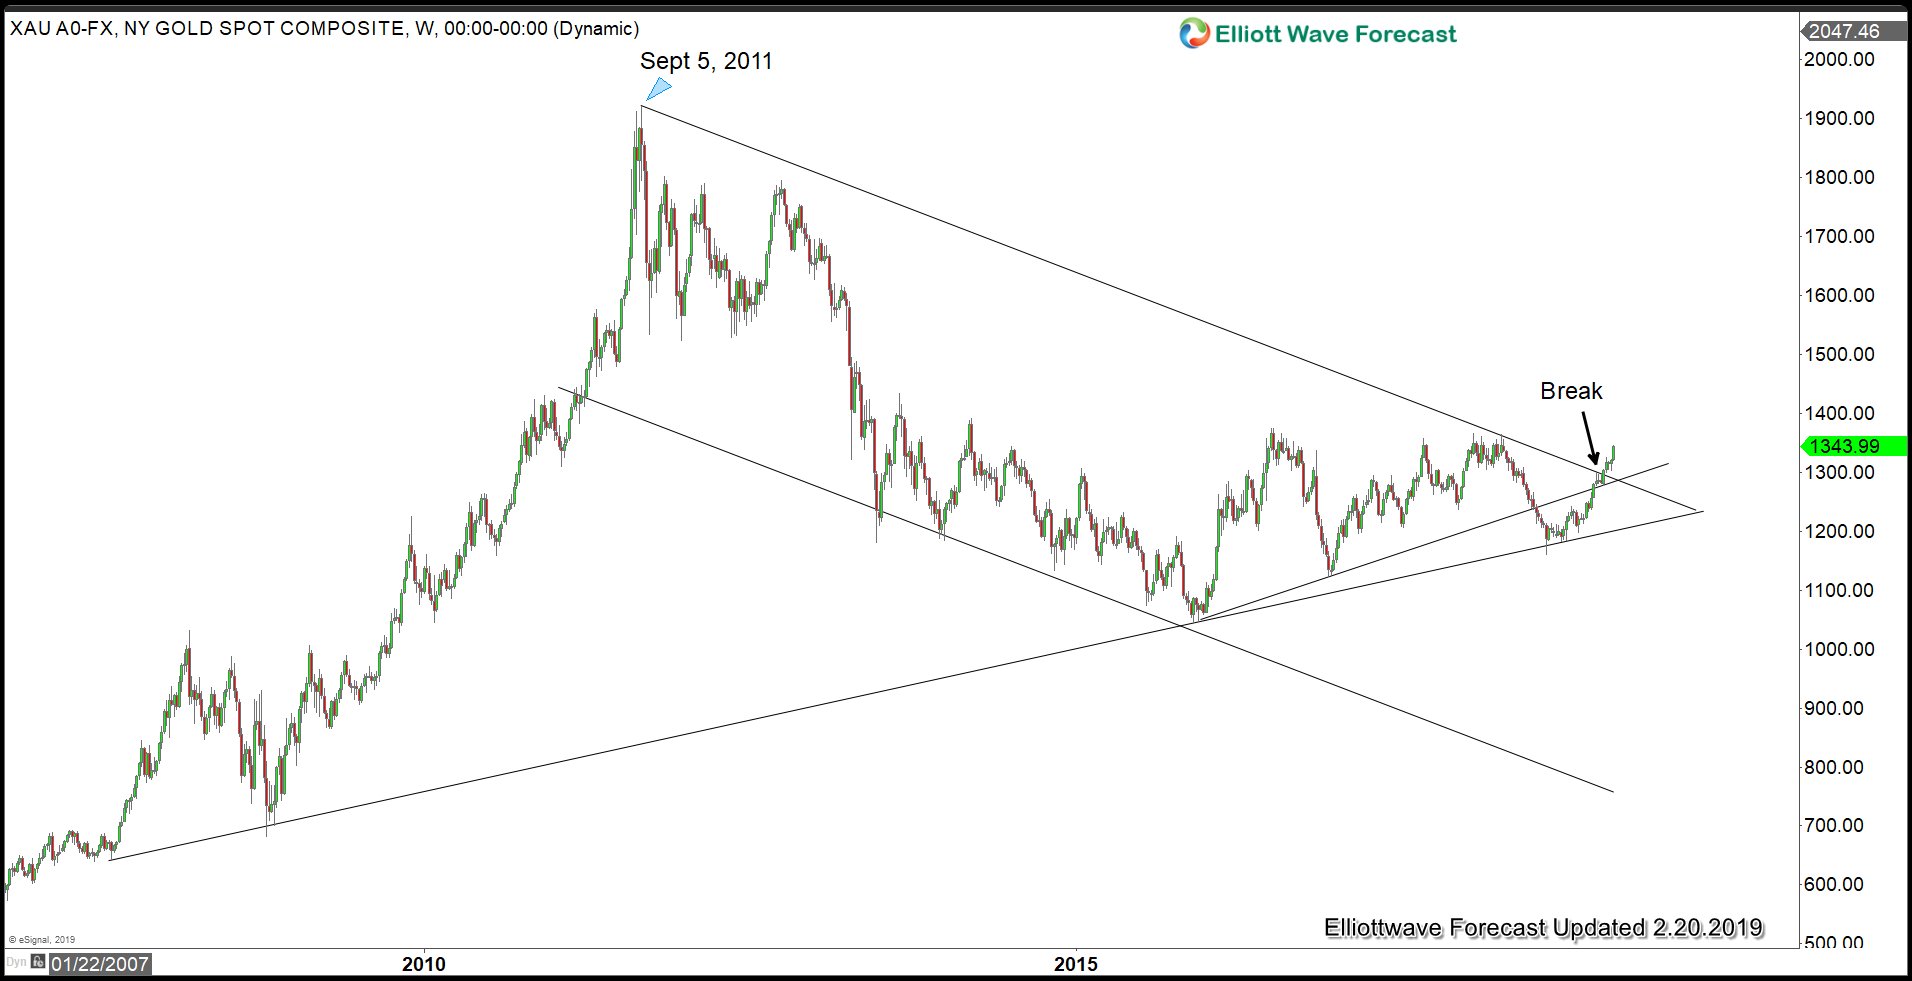
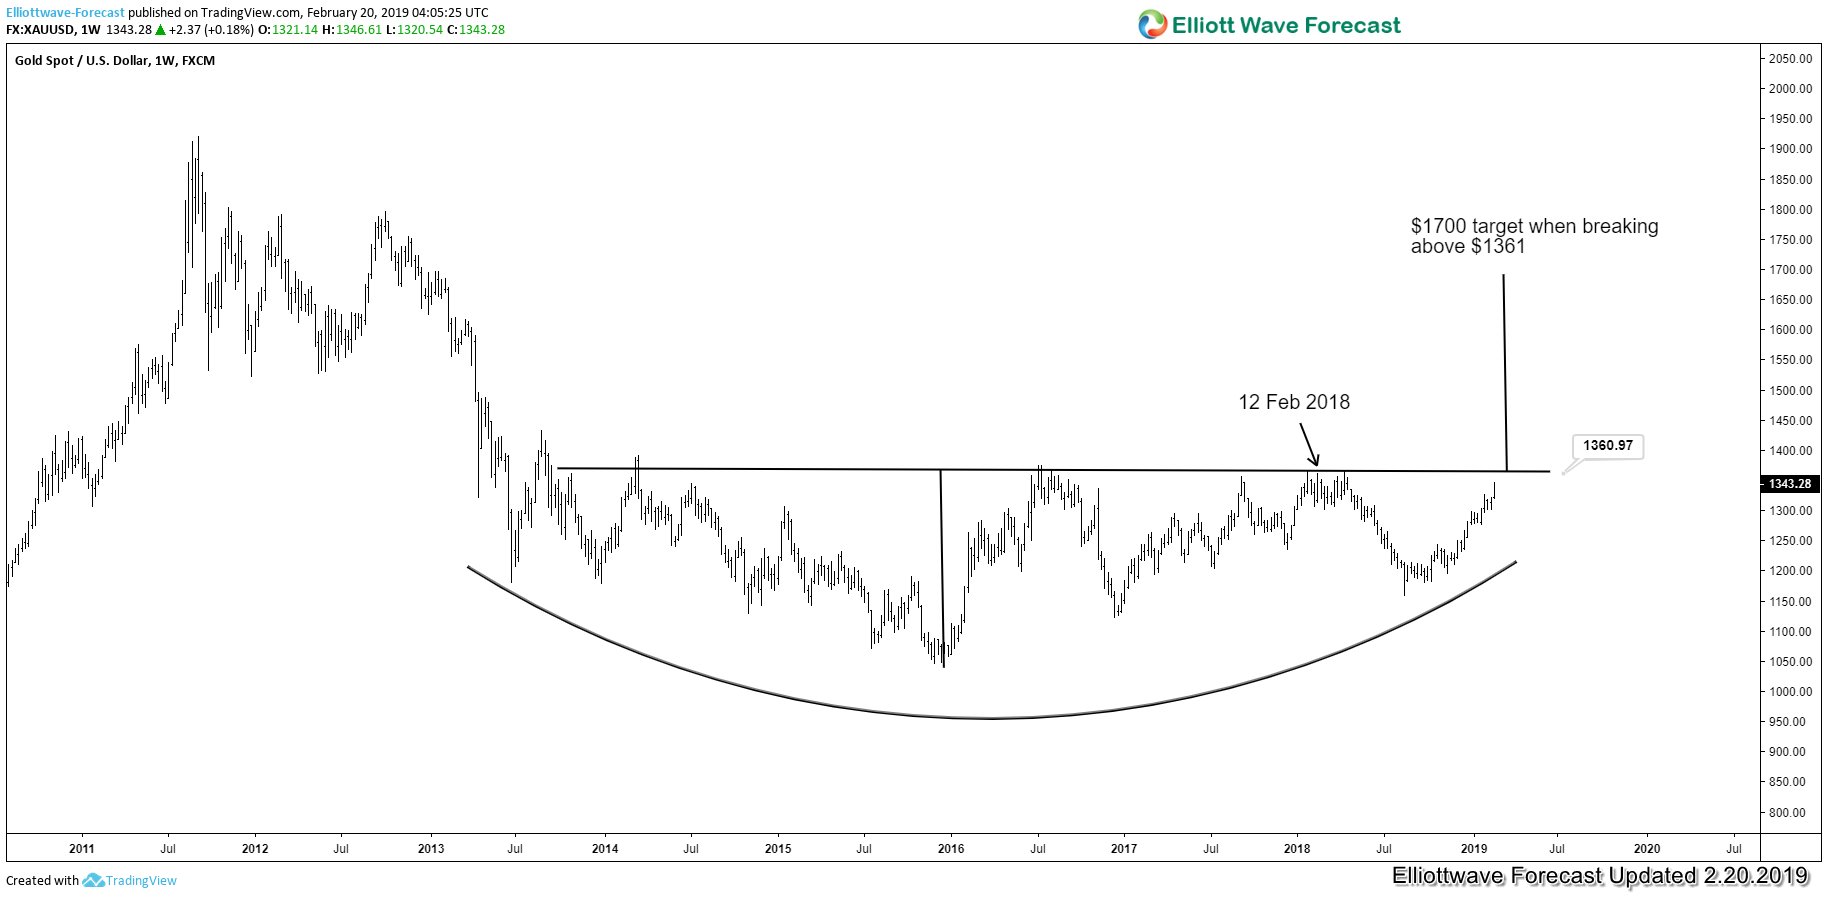
We mention that the next logical swing target for the yellow metal is to retest 2018 high at $1360 area. This level has provided resistance for the past 5 years and thus is a significant level to watch. A decisive break and close above $1360 suggests a more bullish implication with next swing target to as high as $1700. The chart below shows the 5 year rounding bottom formation in Gold
An Elliott Wave analysis of Gold against World Currency Unit (WOCU), a weighted basket of 20 fiat currency pairs covering top 20 world economies, also suggests a breakout
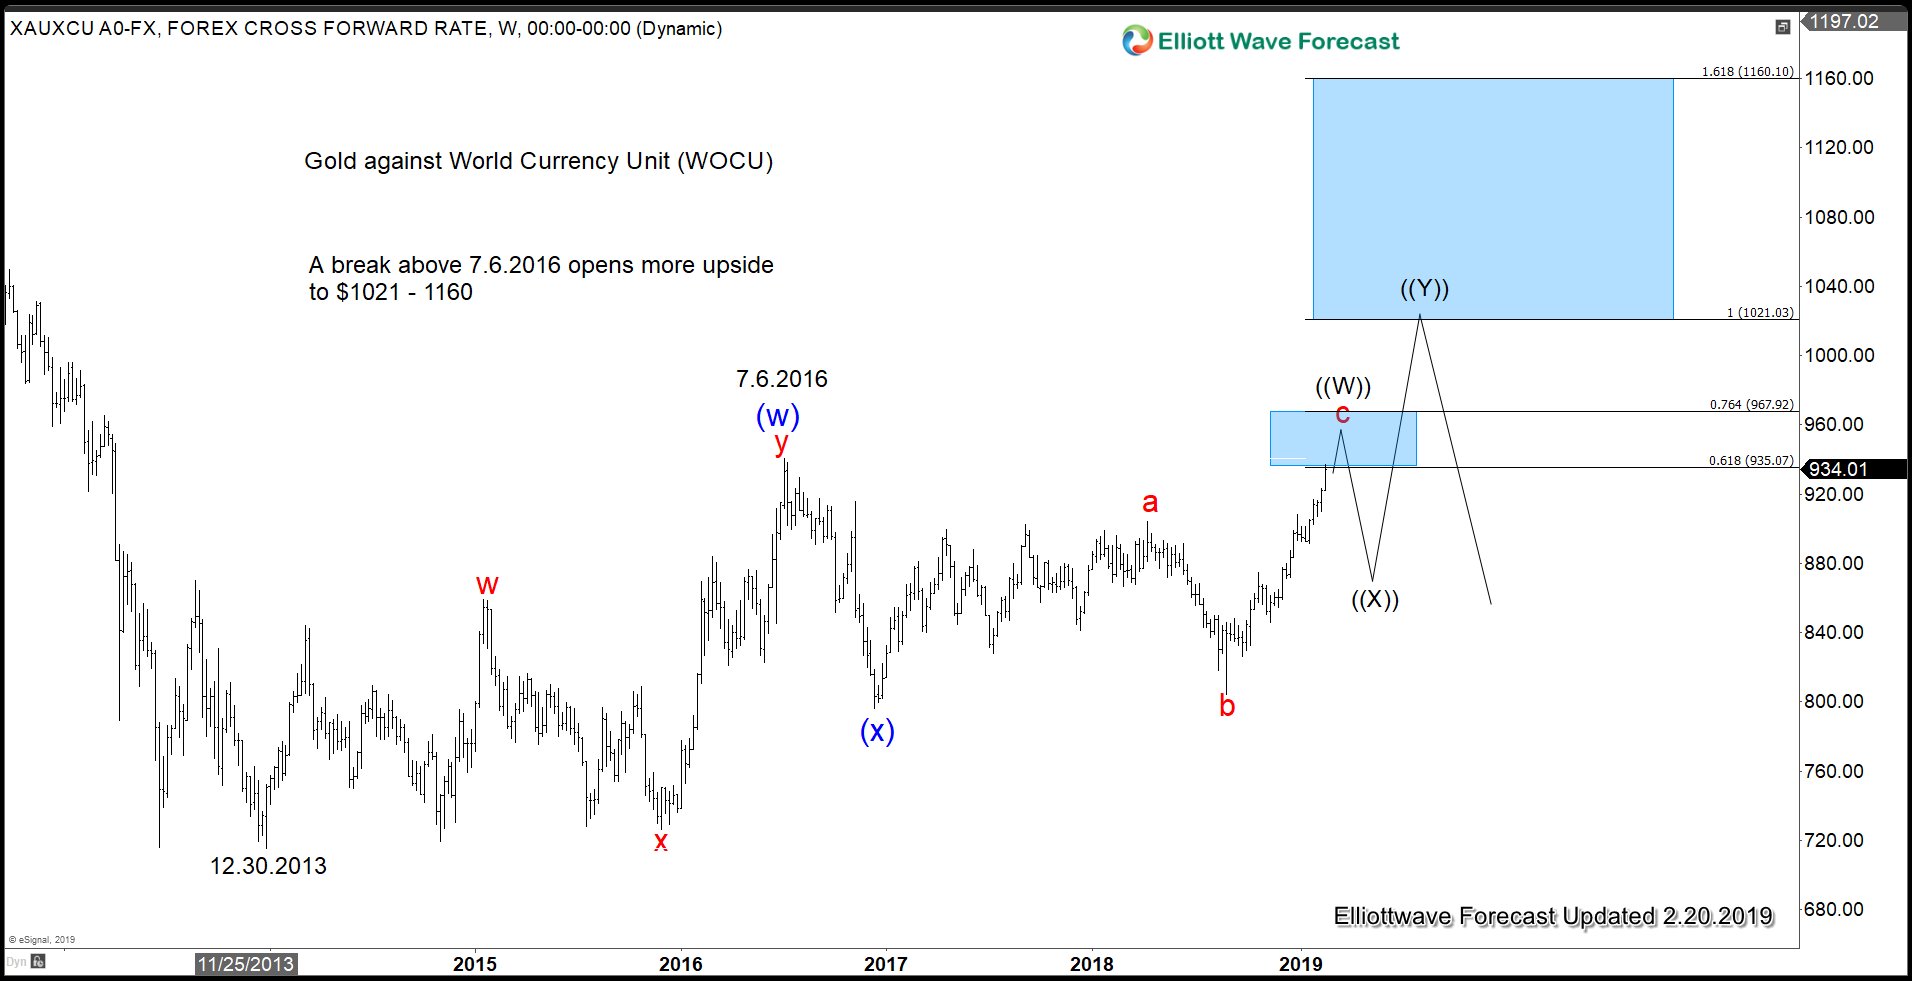
In the chart above, a break above 7.6.2016 high will create 5 swing bullish sequence from 12.30.2013 low and opens up more upside to $1021 - $1160 area.
Gold 1 Hour Elliott Wave Chart
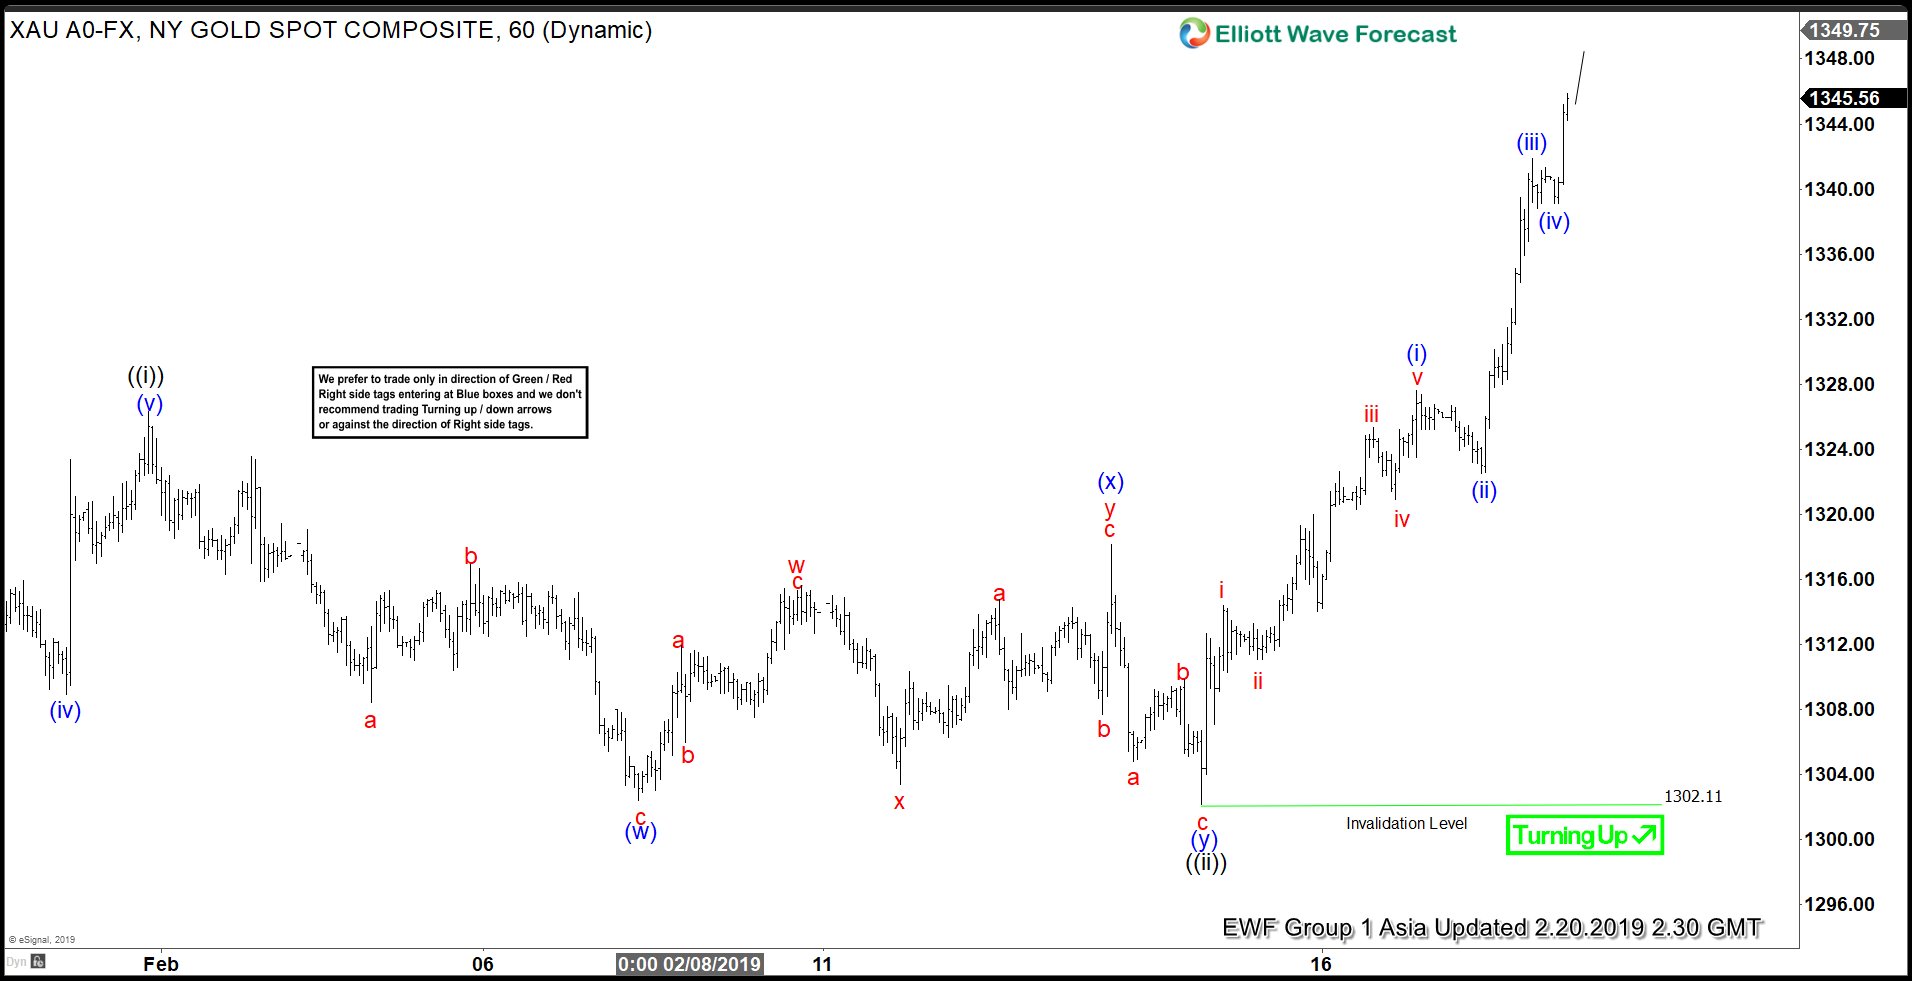
In this article, we will look at the short term 1 hour chart for Gold. The rally from Aug 16, 2018 low is still in progress as an Elliott Wave Impulse structure. We propose the current rally is still within wave (3) from Aug 16, 2018 low as momentum remains strong. Focusing on the shorter cycle, the rally from 1/21/2019 low ($1276.40) is unfolding in 5 waves of lesser degree. Wave ((i)) ended at $1326.30 and wave ((ii)) ended at $1302.16. Wave ((iii)) remains in progress and while short term pullback stays above $1302.11, expect Gold still to extend higher. Caution is warranted once Gold does retest $1360 as this level provides resistance in the past 5 years. We expect the 5 waves up from Aug 16, 2018 low to end between $1360 - $1400.