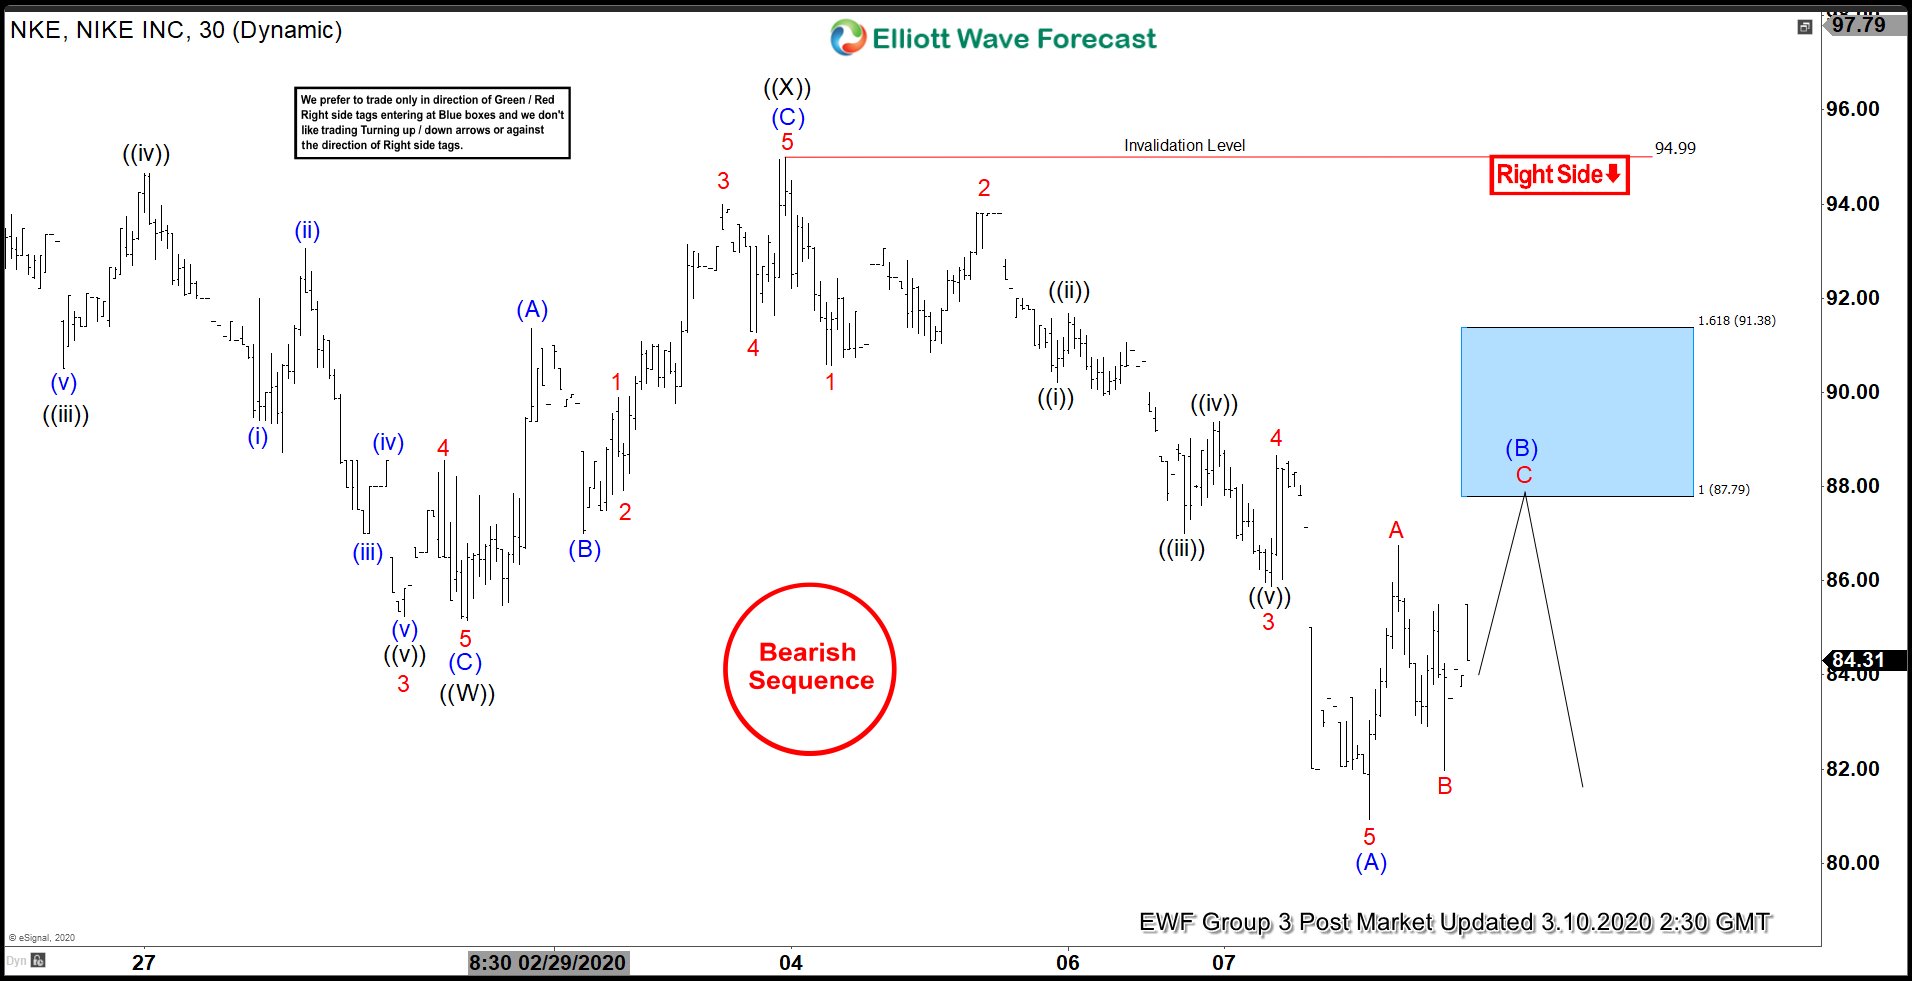
Nike (Ticker: NKE) shows an incomplete sequence from January 22, 2020 high suggesting further downside is likely. The decline from January 22 high is unfolding as a double three Elliott Wave structure where wave ((W)) ended at 85.15 and wave ((X)) ended at 94.98. The stock has resumed lower within wave ((Y)) and the internal of wave ((Y)) subdivided as a zigzag structure.
Down from March 3 wave ((X)) high at 94.99, wave 1 ended at 90.57 and wave 2 bounce ended at 93.79. The stock then resumed lower in wave 3 towards 85.88 and bounce in wave 4 ended at 88.67. The final leg wave 5 ended at 80.92 and this also completed wave (A). Wave (B) rally is now in progress to correct cycle from March 3 high before the decline resumes. Expect rally to complete at 87.79 - 91.38 area and stock to resume lower.
We don’t like buying the stock. As far as pivot at 94.99 high stays intact, expect rally in Nike to fail in the sequence of 3, 7, or 11 swing for more downside. Potential target lower is 100% - 123.6% Fibonacci extension from January 22 high which comes at 69.93 - 74.7.
