Short-term Elliott Wave view in Nike (ticker: NKE) suggests that rally from May 31, 2019 low is unfolding as a 5 waves Elliott wave impulsive structure. Up from May 31, 2019 low, wave 1 (not shown on the chart below) ended at 89.87. Wave 2 pullback ended at 78.19 and stock then resumed higher in wave 3 towards 96.87. Pullback in wave 4 ended at 88.74. Stock is now in wave 5 which has an internal of 5 waves in lesser degree.
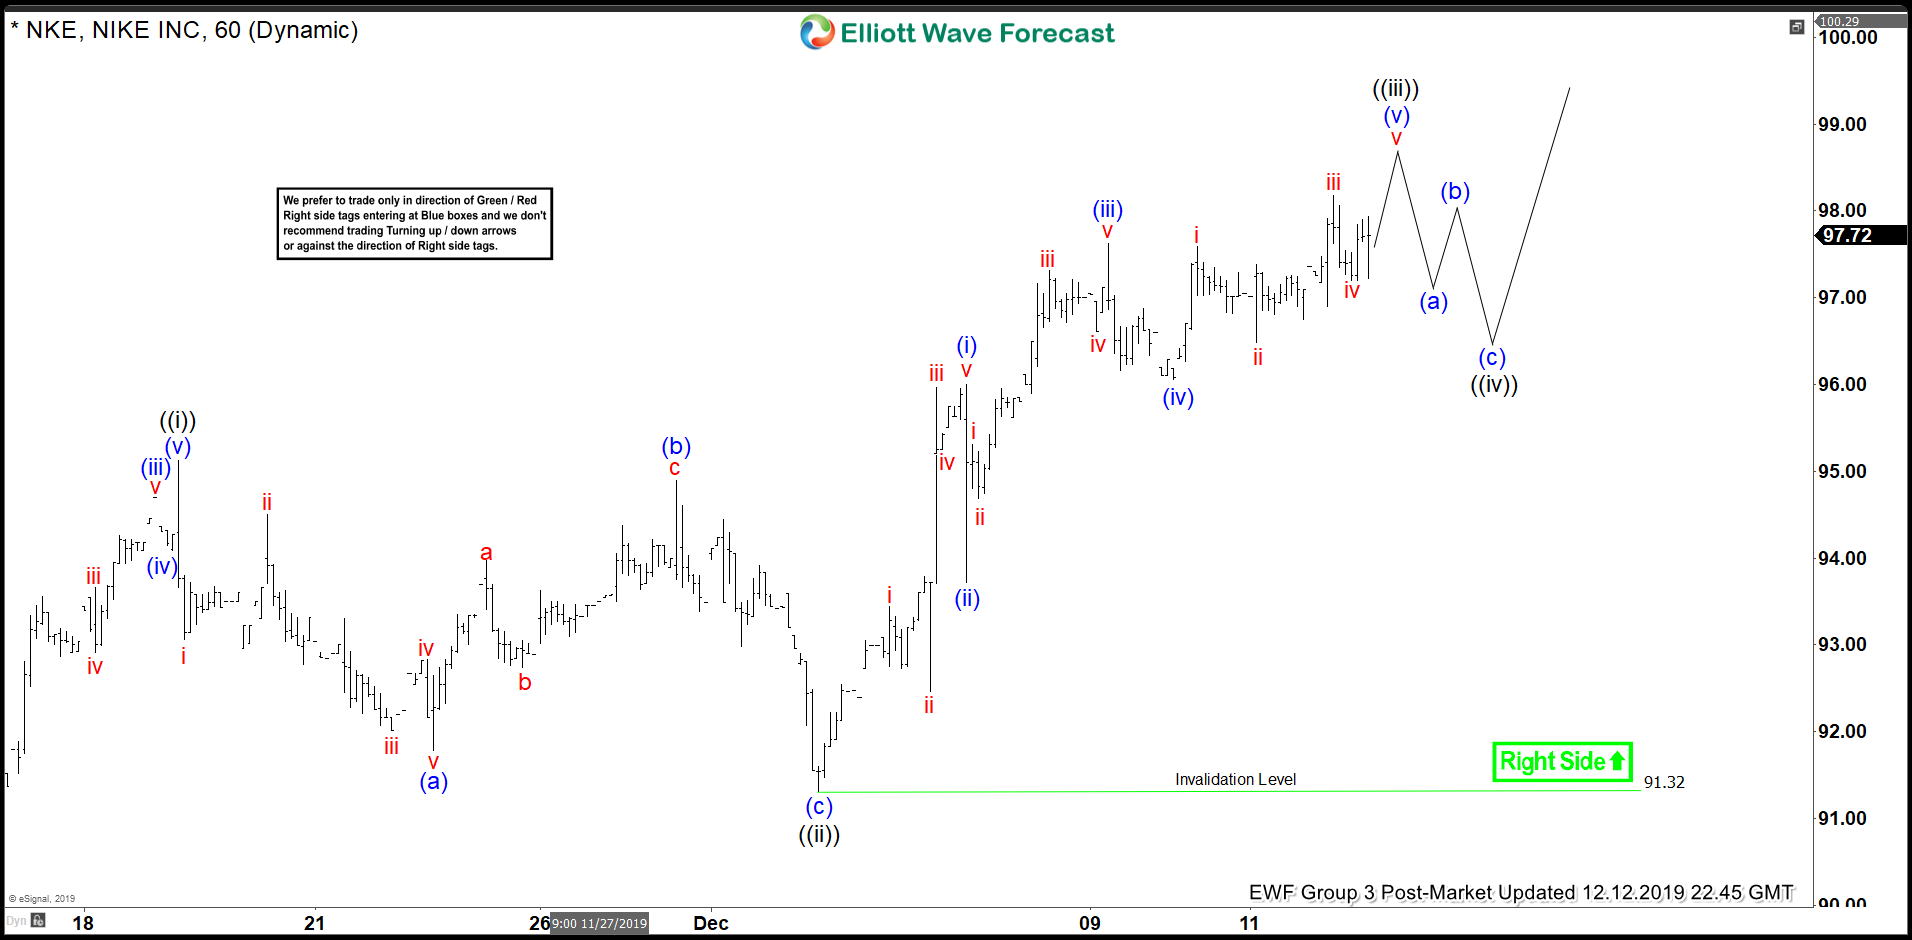
Short term chart below shows the internal subdivision for wave 5. Wave ((i)) of 5 ended at 95.12, and wave ((ii)) of 5 pullback ended at 91.31. Stock has resumed higher and expected to end wave ((iii)) of 5 soon. Afterwards, it should pullback in wave ((iv)) of 5 before the rally resumes again in wave ((v)) of 5. We don’t like selling the stock and expect buyers to appear in the sequence of 3, 7, or 11 swing as far as pivot at 91.3 low stays intact. Potential target to the upside is wave 5 = 1 which comes at 101.6 - 104.6 area.
Nike (NKE) 1 Hour Elliott Wave Chart