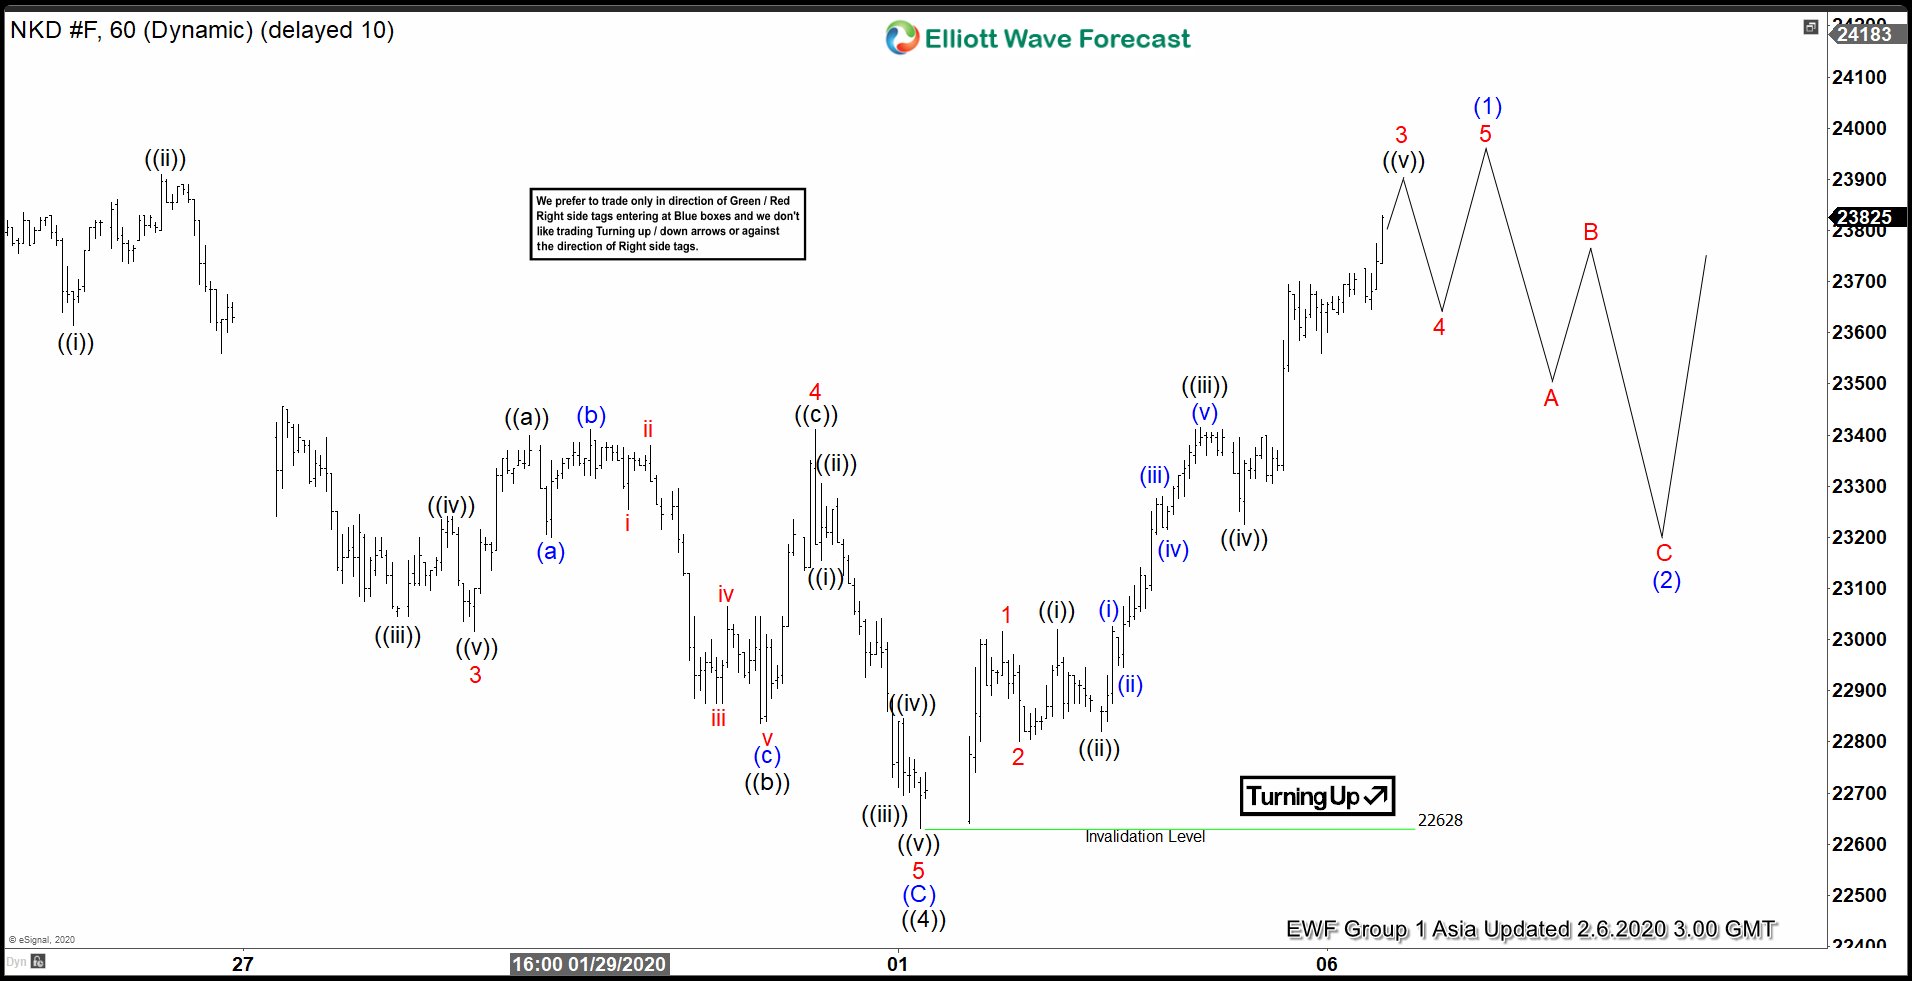
Short term Elliott wave view in Nikkei (NKD_F) suggests the Index ended the correction from December 17, 2019 high in wave ((4)) at 22628. The Index has resumed higher in wave ((5)) although it still needs to break above wave ((3)) on December 17, 2019 high at 24140 to avoid a double correction. However, the rally from February 1, 2010 low (22628) is unfolding as a 5 waves impulse Elliott Wave structure, favoring the upside. Furthermore, other world indices such as $YM_F (Dow Jones Futures) and $NQ_F (Nasdaq) have already broken to new high, supporting the view the next leg higher has started.
Up from February 1, 2020 low (22628), wave 1 ended at 23015 and wave 2 pullback ended at 22800. The Index has resumed higher in wave 3 which subdivides in lesser degree 5 waves. Dips is expected to find support while above 22628 for further upside. We don’t like selling the Index. Near term, expect a few more highs before cycle from February 1 low ends as 5 waves in wave (1). Afterwards, it should correct cycle from February 1 low in wave (2) before the next leg higher. As far as pivot at 22628 low stays intact, expect dips to continue finding support in 3, 7, or 11 swing for further upside.
Nikkei 1 Hour Elliott Wave Chart