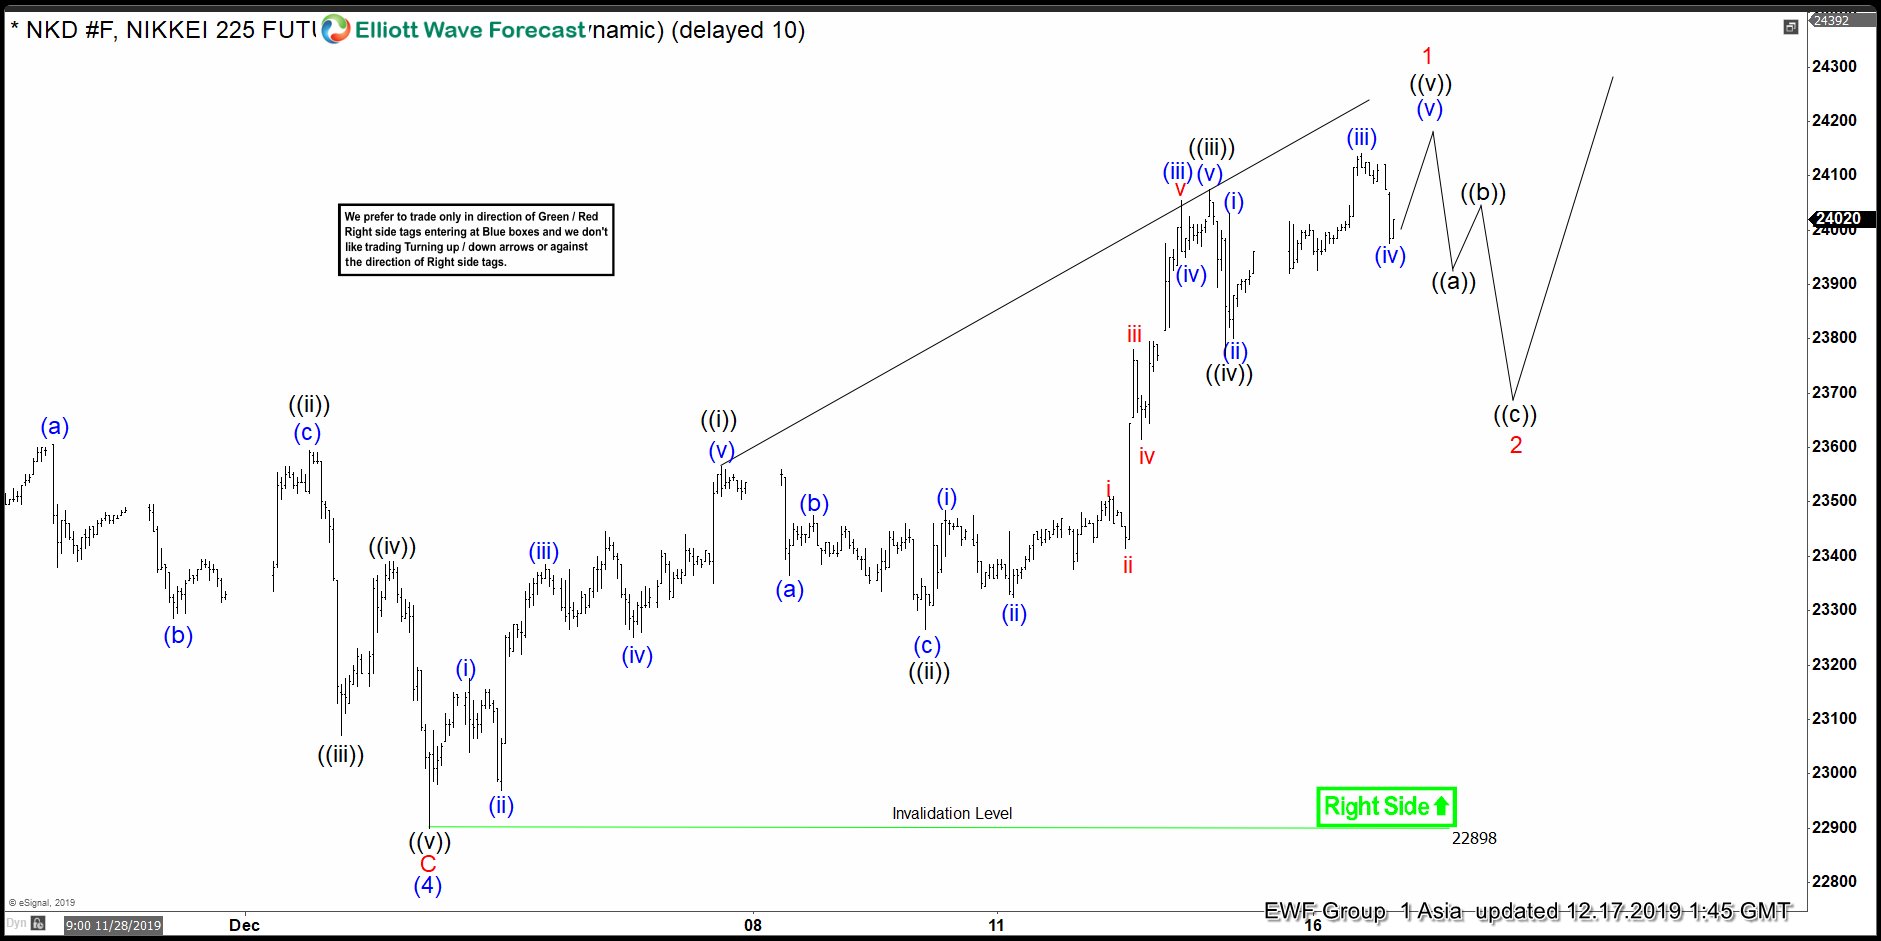
Elliott Wave view in Nikkei (NKD_F) suggests that the Japanese Index ended wave (4) on December 3 at 22898. This is part of a bigger impulsive 5 waves rally from August 25, 2019 low (not shown on the chart). Up from August 25, 2019 low, wave (1) ended at 21970, wave (2) pullback ended at 21070, wave (3) ended at 23660 and wave (4) ended at 22898.
In the 1 hour chart below, we can see the Index has resumed higher in wave (5). The rally from December 3, 2019 low is unfolding as a 5 waves Elliott wave impulsive structure. Up from 12/3/2019 low, wave ((i)) ended at 23565 and wave ((ii)) pullback ended at 23265. The Index then extended higher in wave ((iii)) towards 24075 and pullback in wave ((iv)) ended at 23770.
Index is expected to end wave ((v)) soon with another leg higher. This final leg should also end wave 1 in higher degree. Afterwards, Index should correct cycle from December 3, 2019 low within wave 2 before the rally resumes. We don’t like selling the proposed pullback and prefer buying wave 2 dips in 3, 7, or 11 swing as far as pivot at 22898 low stays intact. Potential target for wave (5) is 100% - 123.6$ Fibonacci extension of wave (1) towards 25171 - 25707.
