After forming the low on December 24, 2018 low at $42.36, Oil has continued to recover. The rally from Dec 24 last year looks to be unfolding as a zigzag Elliott Wave Structure. The instrument should soon reach the minimum 100% target at $63 - $65.8 and this area can potentially end the cycle from Dec 24, 2018 low. Expect some profit taking and larger 3 waves pullback when Oil reaches this area.
Near term, Oil is within wave (©) of the zigzag structure. As zigzag is a 5-3-5 structure, wave (©) subdivides into 5 waves. In the 1 hour chart below, we can see the wave (3) and (4) of this (©) leg. Rally to $60.39 ended wave (3) and pullback to $58.18 ended wave (4). Wave (5) is in progress as an ending diagonal. Up from $58.18, wave 1 ended at $60.38 and wave (2) pullback ended at $58.20
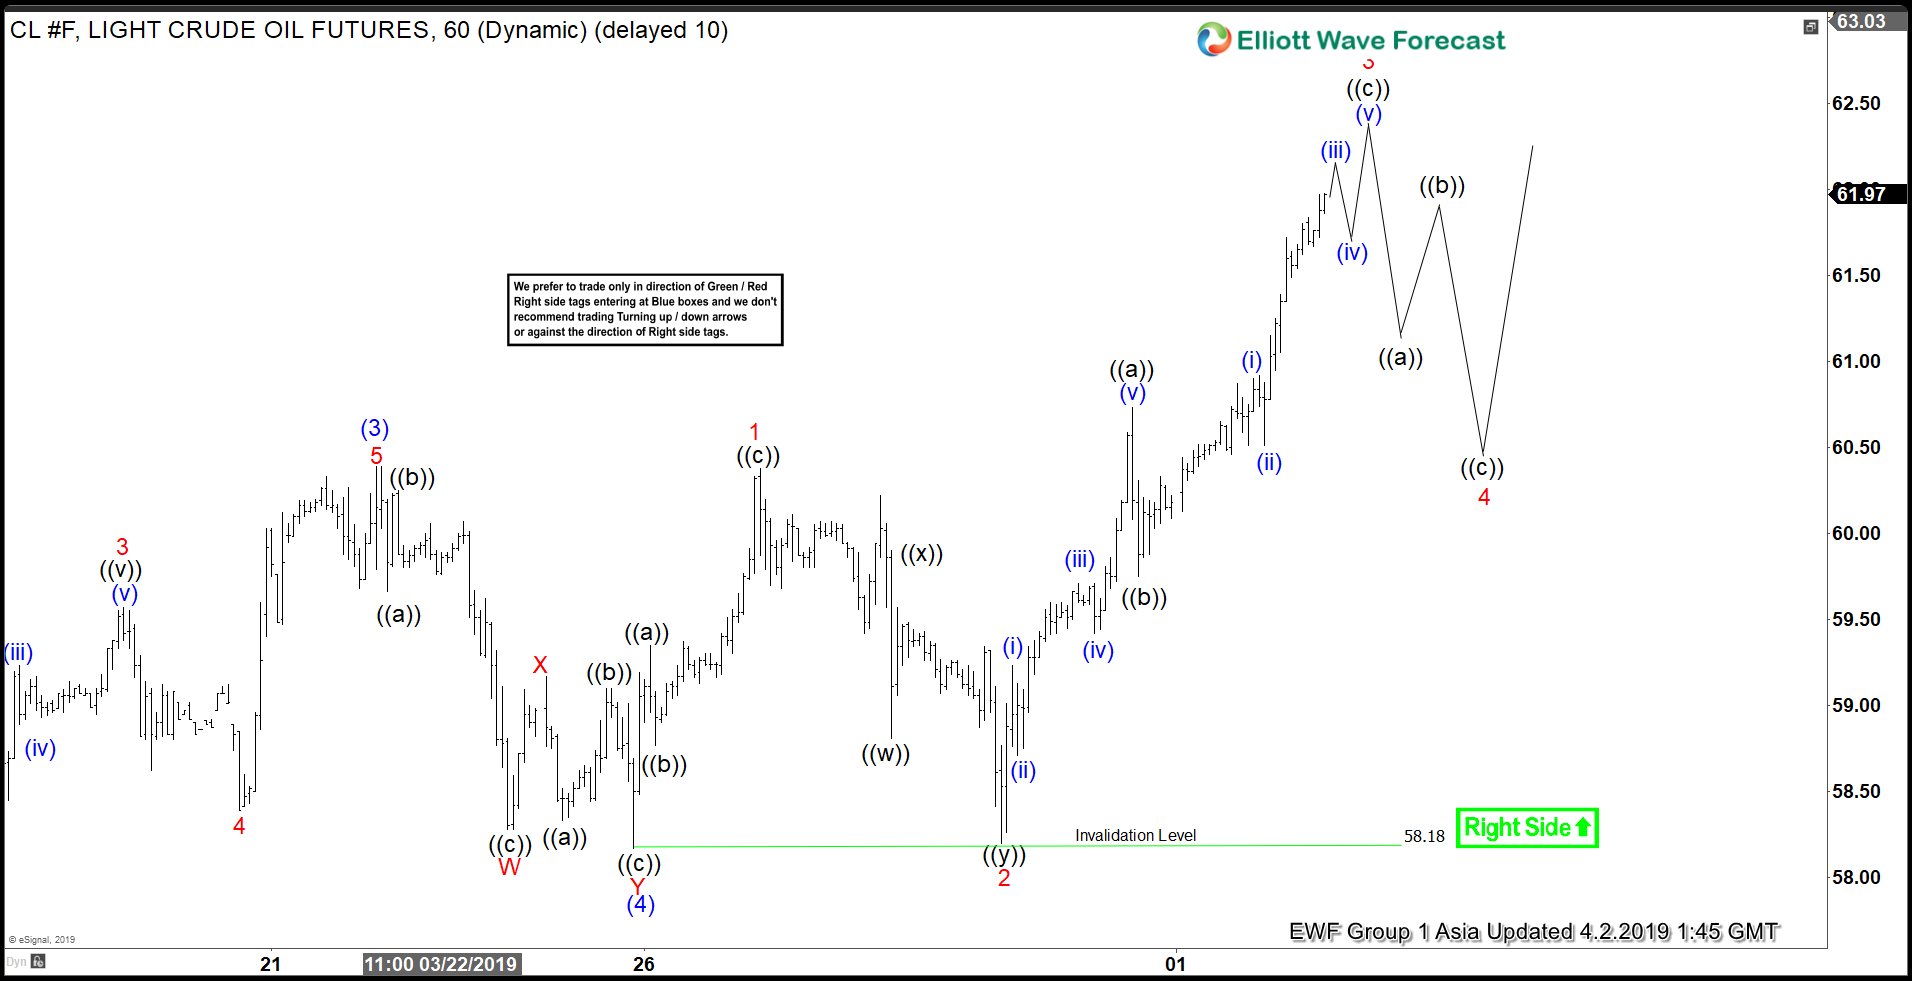
Expect wave 3 to end soon and wave 4 pullback to commence. While the dips stay above $58.18, oil should do 1 more leg higher in wave 5 of (5). This push higher should also end wave (©) of the zigzag from Dec 24, 2018 low. Afterwards, expect profit taking and larger pullback in Oil.
1 Hour Oil Elliott Wave Chart