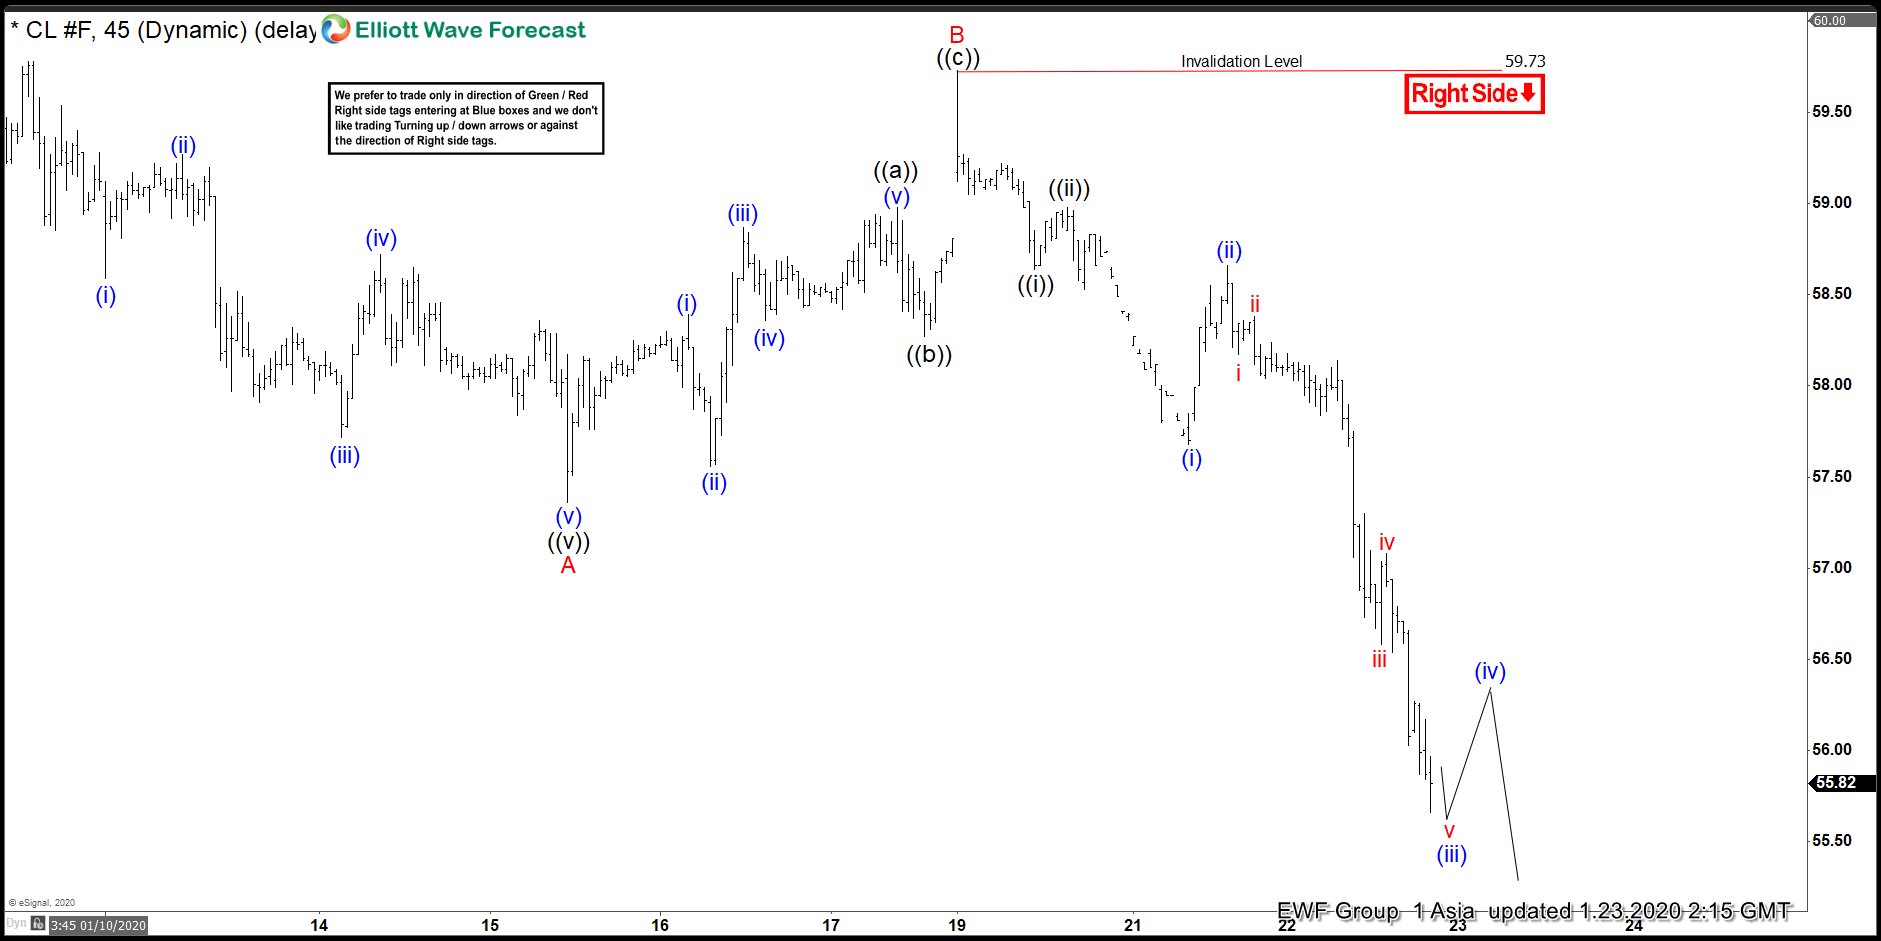
Oil has extended lower and short term Elliott Wave view suggests the decline from 1.8.2020 high is unfolding as a zigzag Elliott Wave structure. Down from January 8 high, wave A ended at 57.36 as a 5 waves impulsive structure. Bounce in wave B ended at 59.73 as a zigzag structure. Up from 57.36, wave ((a)) of B ended at 58.98, wave ((b)) of B ended at 58.27, and wave (©) of B ended at 59.73.
Oil then extended lower and broke below wave A at 57.36, suggesting the next leg lower in wave C has started. Wave C subdivides in a 5 waves impulsive structure. Down from wave B at 59.73, wave ((i)) ended at 58.64 and wave ((ii)) ended at 58.98. Wave ((iii)) of C remains in progress and nesting with 5 sub waves extension. Near term, expect a few more lows to complete the 5 waves structure within wave C. The nearest potential target to the downside is 61.8 - 76.4% of A-B which comes at $53.2 - $54.4. Near term, expect any rally to fail in the sequence of 3, 7, or 11 swing for more downside. This view remains valid far as pivot at 59.73 high stays intact.
