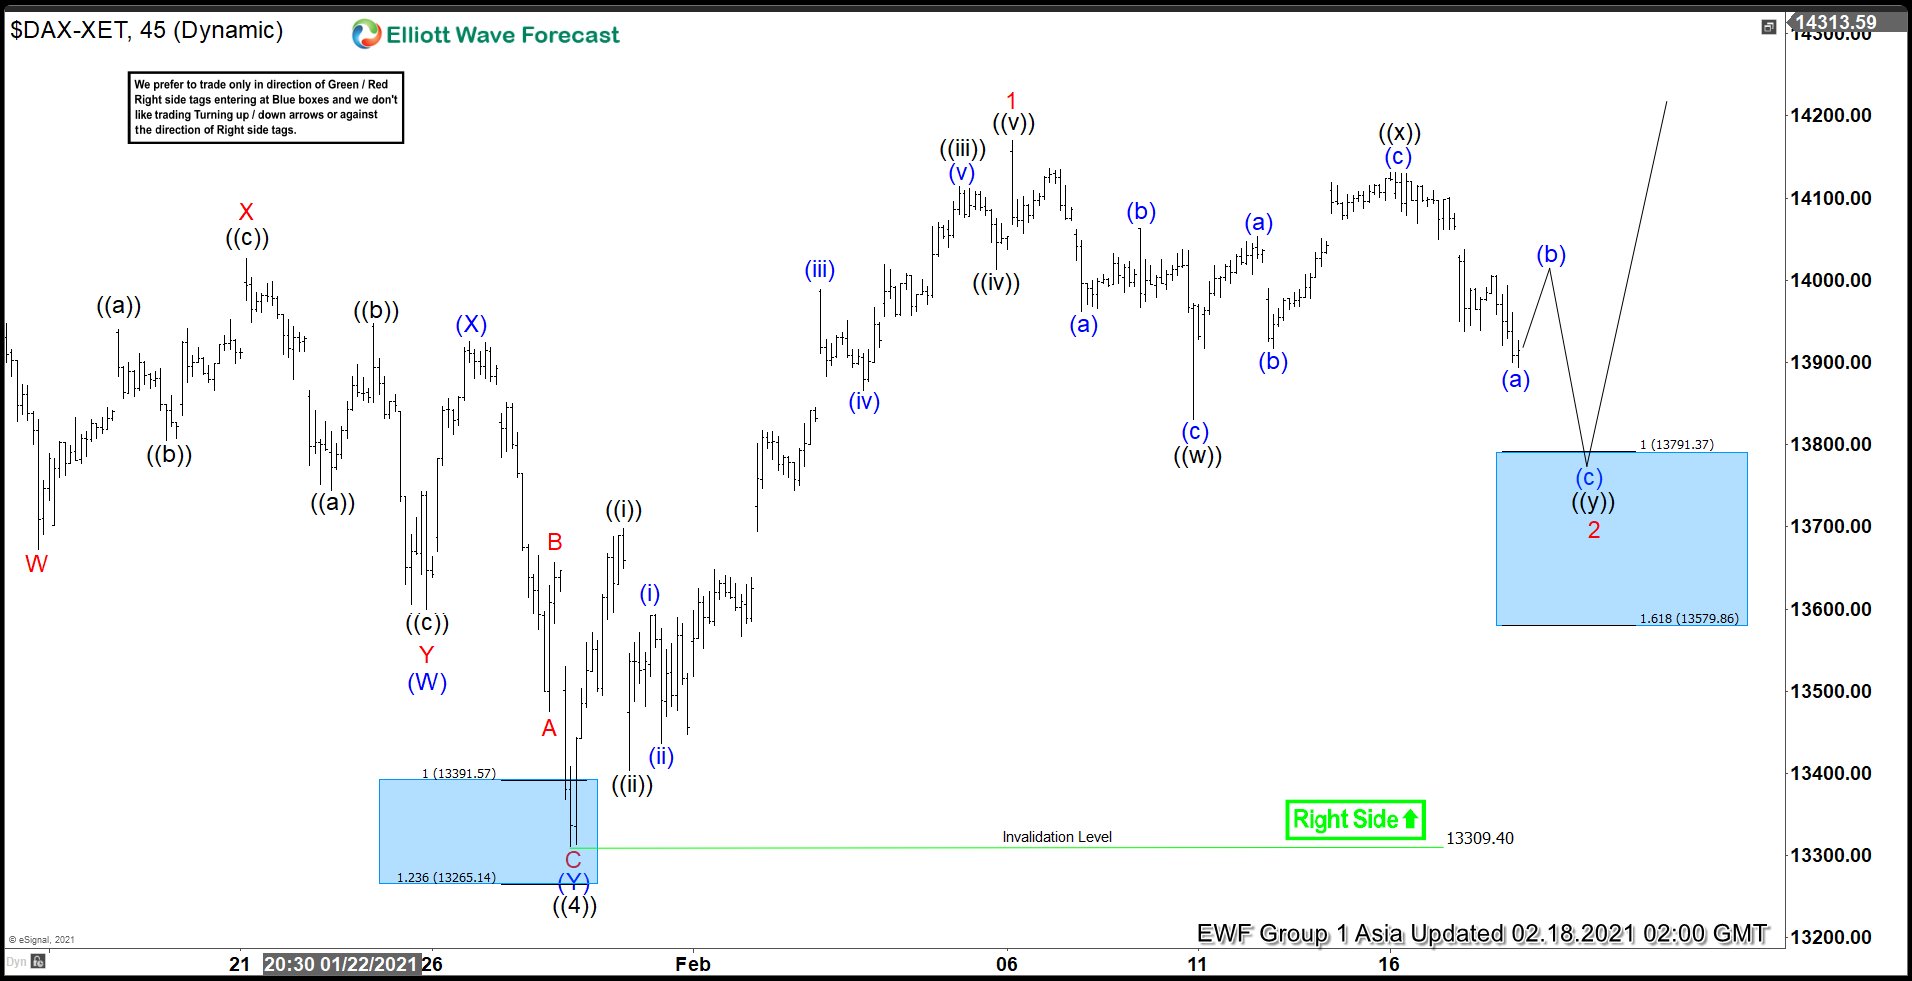
Short term Elliott Wave view on DAX suggests that the decline to 13309.4 ended wave ((4)). The Index has resumed higher in wave ((5)) with internal subdivision as a 5 waves impulse Elliott Wave structure. Up from wave ((4)) low, wave ((i)) ended at 13698.54 and wave ((ii)) pullback ended at 13403.74. Index then resumed higher again in wave ((iii)) towards 14114.44, pullback in wave ((iv)) ended at 14013.13, and final leg higher wave ((v)) ended at 14169.49. This completed wave 1 in higher degree.
Index then pullback in wave 2 and the internal subdivision is unfolding as a double three Elliott Wave structure. Down from wave 1, wave (a) ended at 13962.14, wave (b) ended at 14063.12, nd wave © ended at 13830.12. This completed wave ((w)) in higher degree. Bounce in wave ((x)) ended at 14131.21. Index has scope to extend lower in wave ((y)) as zigzag towards 13579 - 13791 blue box area where wave ((y)) = 100% - 161.8% Fibonacci extension of wave ((w)). This should complete wave 2 pullback and from this area, Index can either resume to new high or bounce in 3 waves at least.