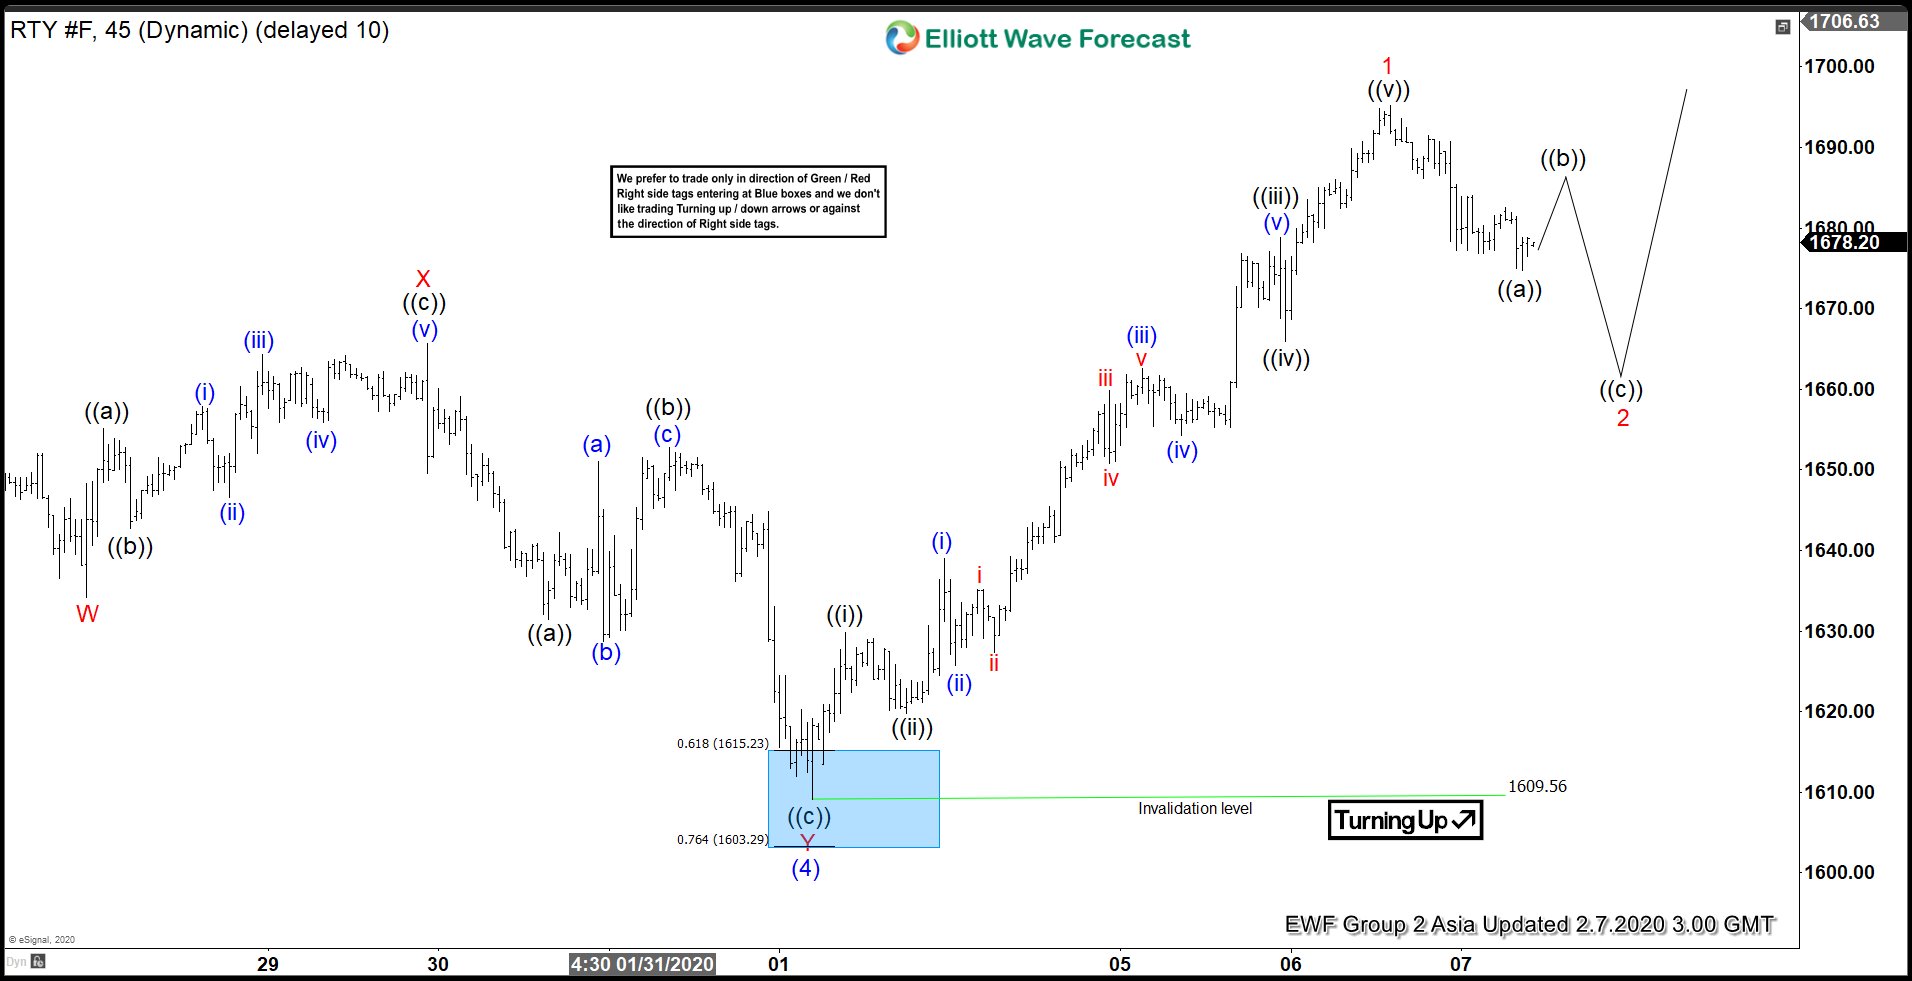
Short term Elliott wave view in Russell (RTY_F) suggests the Index ended the correction from January 17, 2020 high in wave (4) at 1609.56. It has since resumed higher in wave (5) and the internal subdivision is unfolding as a 5 waves impulse Elliott Wave structure, The Index still needs to break above wave (3) at 1715.1 to avoid a double correction in wave (4). However, other US Indices such as YM_F (Dow Jones Futures), ES_F (S&P Futures), and NQ_F (Nasdaq) have broken above the previous peak, supporting more upside in Russell as well.
Up from February 1 or wave (4) low, wave ((i)) ended at 1629.8 and wave ((ii)) pullback ended at 1619.80. Index then resumes higher in wave ((iii)) towards 1678.8 and pullback in wave ((iv)) ended at 1665.90. Index resumes the final leg higher in wave ((v)) towards 1695.20. The 5 waves move higher completed wave 1. Index is now within wave 2 pullback to correct cycle from February 1, 2020 low before the rally resumes. As far as pivot at 1609.56 low stays intact, expect pullback to find support in the sequence of 3, 7, or 11 swing for further upside.
Russell 1 Hour Elliott Wave Chart