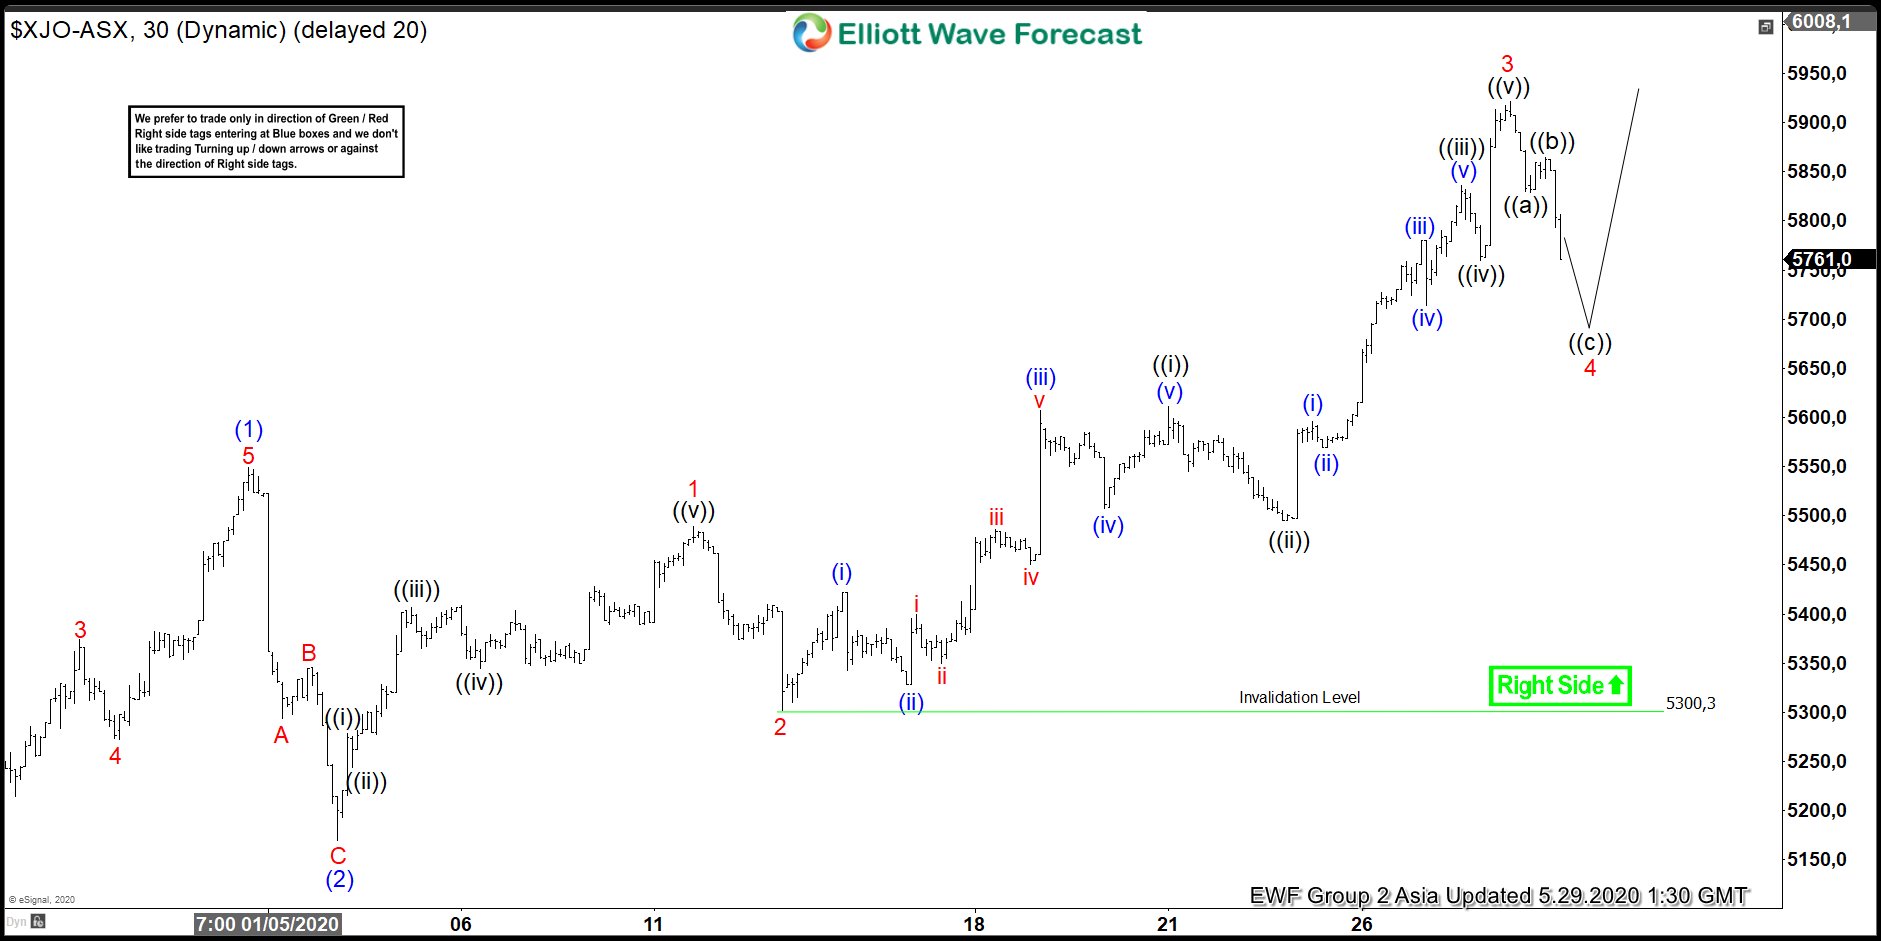
After forming the low on 3.23.2020 low, ASX 200 (XJO) starts a new leg higher. Short term Elliott Wave chart below suggests that the rally from 3.23.2020 low is unfolding as a 5 waves impulsive Elliott Wave structure. Up from 3.23.2020 low, wave ((1)) ended at 5563.6 and pullback in wave ((2)) ended at 5100.7. Index then resumes higher in wave ((3)) and shows a nest. Up from wave ((2)) low at 5100.7, wave (1) ended at 5549.1 and dips to 5169.6 ended wave (2). Wave (3) is currently in progress as another 5 waves of lesser degree.
Up from wave (2) low at 5169.6, wave 1 ended at 5489.5 and dips to 5303.3 ended wave 2. Index then resumes higher in wave 3 towards 5922. Expect wave 4 pullback to find support in 3, 7, or 11 swing before the next leg higher. As far as pivot at 5300.3 low stays intact, expect the Index to extend higher. Potential minimum target for the Index is 100% - 123.6% Fibonacci extension from 3.23.2020 low towards 6268 - 6545
