As a larger context, the rally in Russell 2000 (RTY) from 3.19.2020 low took the form of an impulsive structure. Up from there, wave (1) ended at 1180.3 and wave (2) pullback ended at 1029.7. Index then resumed higher in wave (3) and ended at 1265.6 and wave (4) pullback ended at 1148.5. The final leg wave (5) ended at 1374. This move also completed wave ((1)) in higher degree and ended cycle from 3.19.2020 low. Wave ((2)) pullback is in progress to correct cycle from 3.19.2020 low in 3, 7, or 11 swing before the Index turns higher again.
The 1 hour chart below shows the correction in wave ((2)). The internal subdivision is unfolding as a zigzag Elliott Wave structure. Down from wave ((1)) high at 1374, wave (A) ended at 1220.1 as an impulse in lesser degree. Wave 1 of (A) ended at 1353.6, wave 2 of (A) ended at 1370.60, wave 3 of (A) ended at 1236.5, wave 4 of (A) ended at 1258.80, and wave 5 of (A) ended at 1220.10.
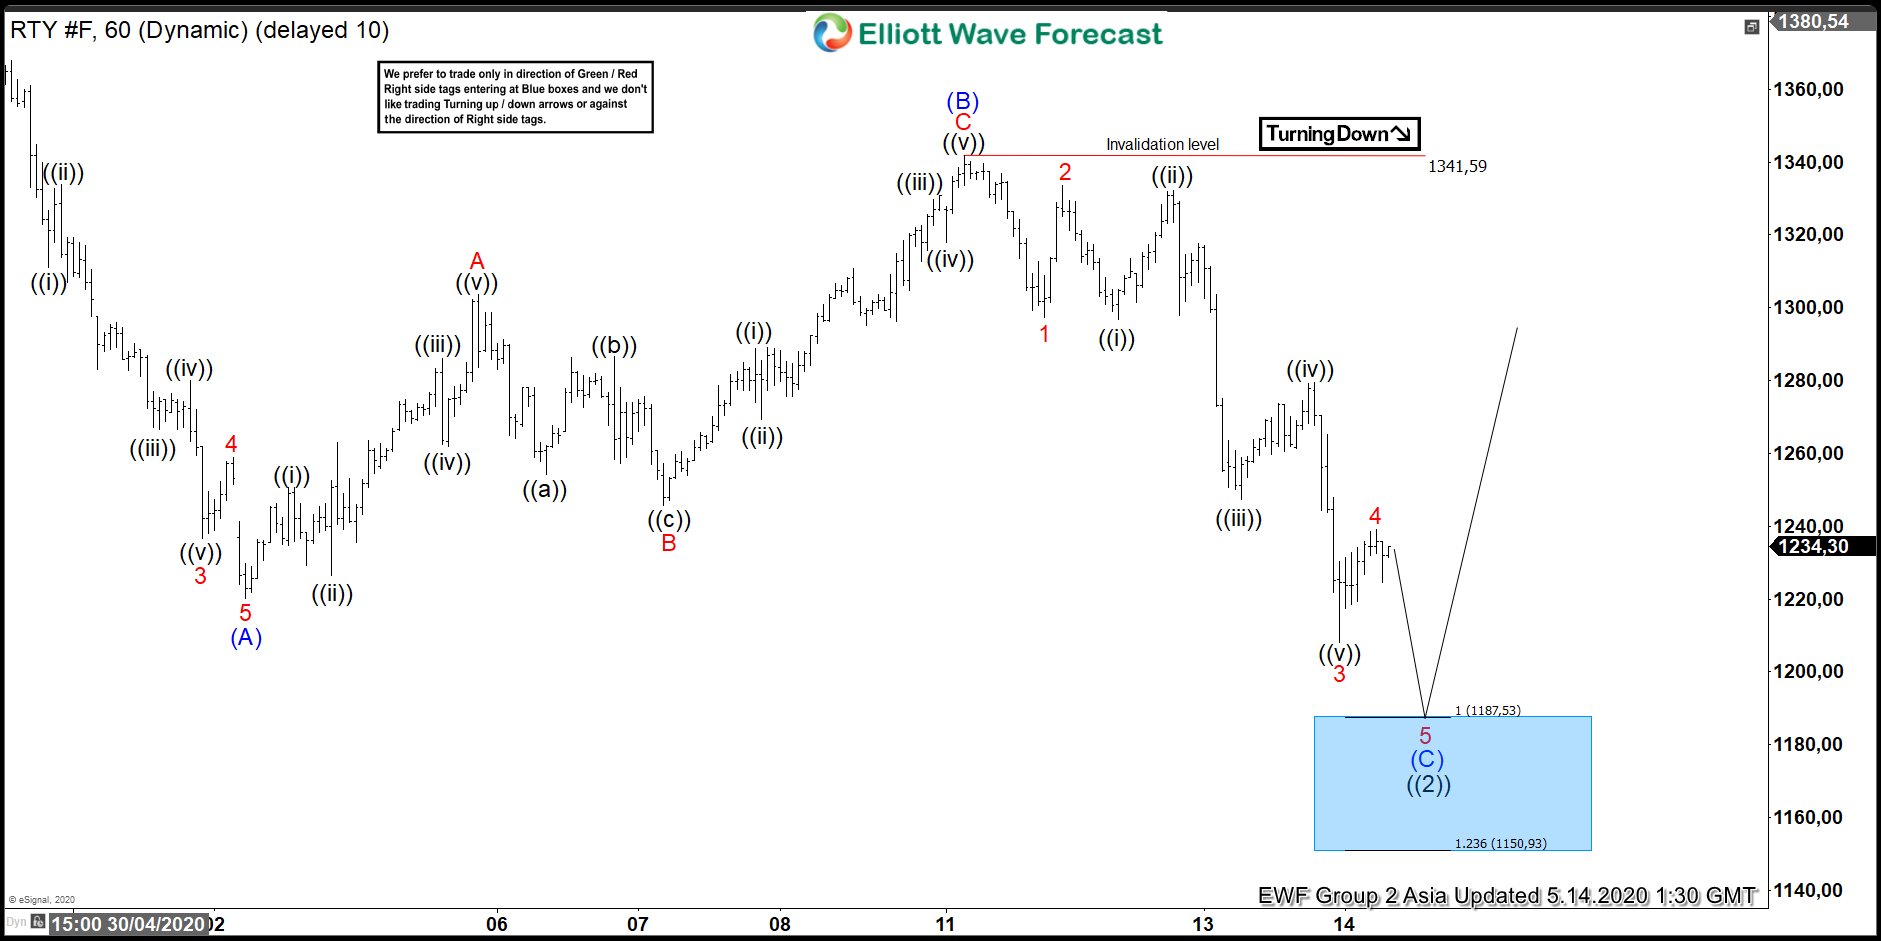
Up from there, wave (B) bounce ended at 1341.6 as a zigzag in lesser degree. Wave A of (B) ended at 1303.7, wave B of (B) ended at 1245.6, and wave C of (B) ended at 1341.70. Wave © is now in progress as 5 waves impulse and can see more downside to reach 1150 - 1187 area. This is the 100% - 123.6% Fibonacci extension of (A)-(B). From this area, Index may see buyers for more upside or 3 waves bounce at least.
Russell 2000 1 Hour Elliott Wave Chart