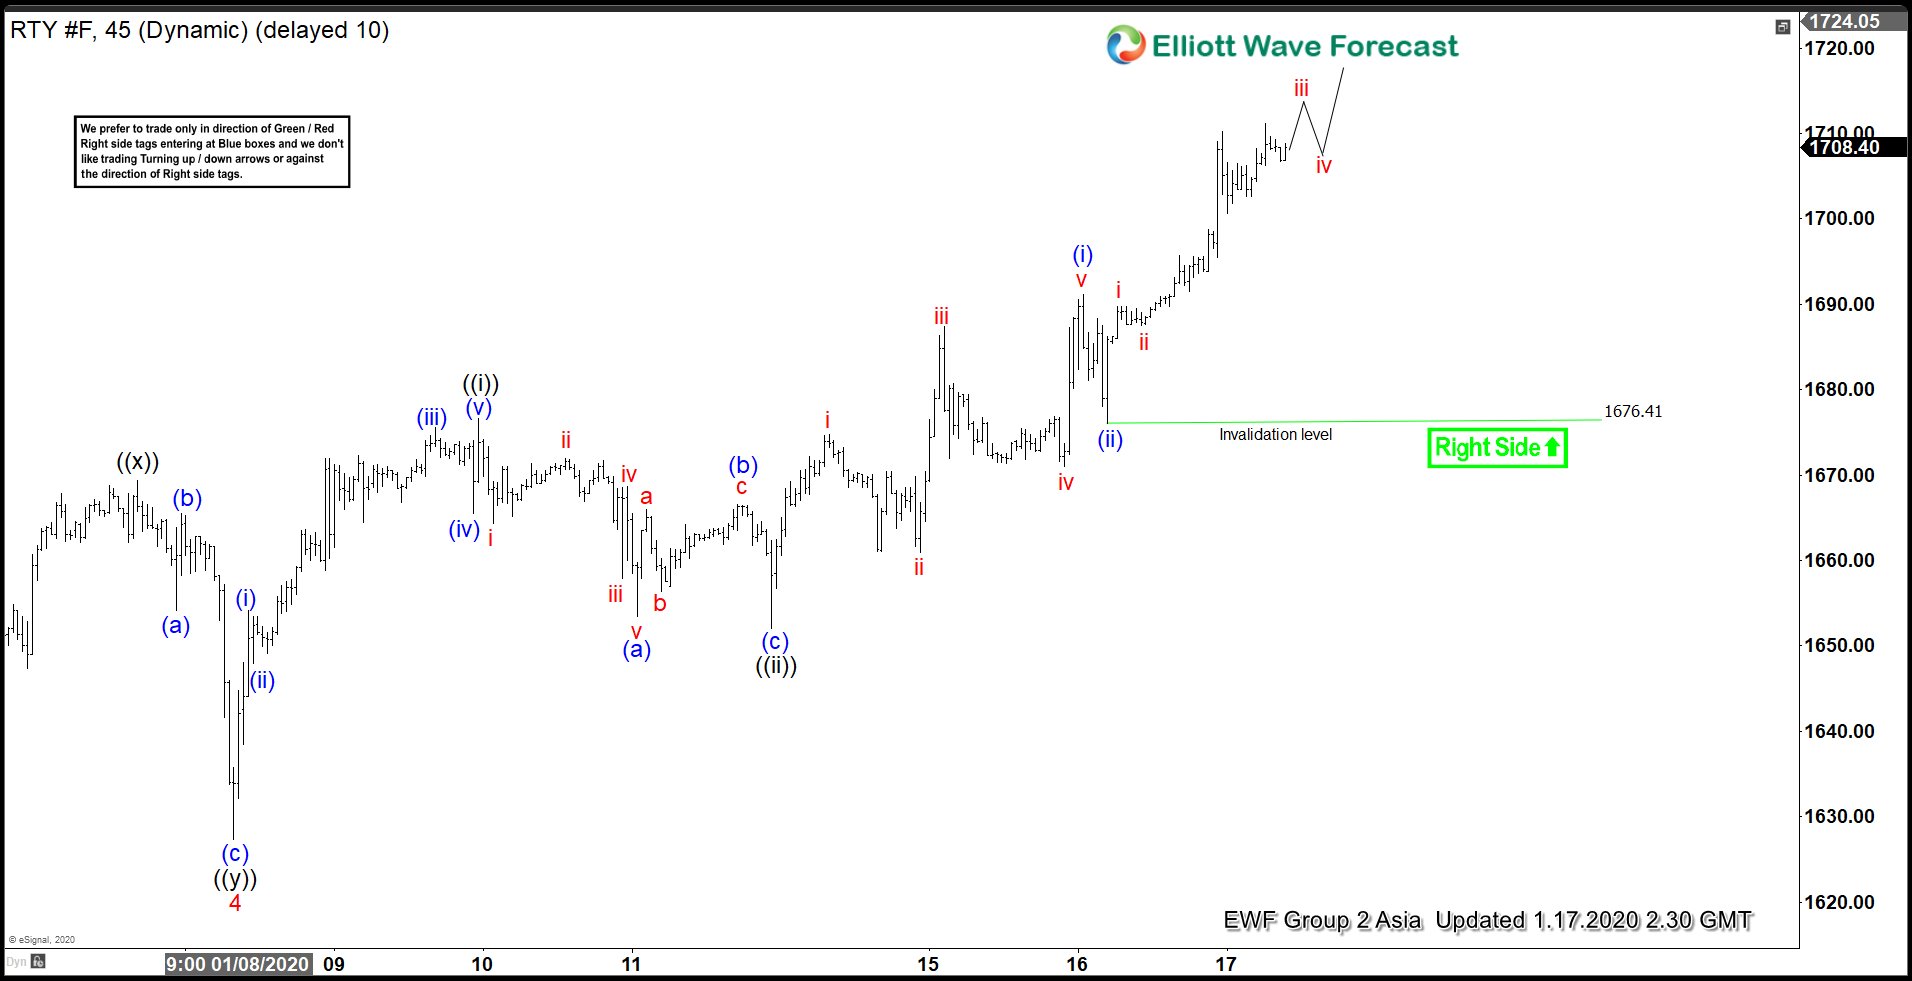
Russell 2000 (RTY_F) shows a 5 waves impulse Elliott Wave structure from August 26, 2019 low. In the 45 minutes chart below, we can see wave (4) of the impulse structure ended at 1627.3. The Index has resumed higher in wave 5 with subdivision of another 5 waves in lesser degree. Up from 1627.3, wave ((i)) ended at 1676.6 and wave ((ii)) pullback ended at 1652. Wave ((iii)) of 5 now remains in progress and shows an extension. Up from 1652, wave (i) of ((iii)) ended at 1691.2 and pullback in wave (ii) of ((iii)) ended at 1676.41.
Near term, while dips remain above 1676.41, expect the Index to continue higher. Possible target of wave ((iii)) is 161.8% Fibonacci extension of wave ((i)) which comes at 1732.04. Afterwards, Index should pullback in wave ((iv)) and then extend higher again in wave ((v)) of 5 before ending cycle from August 26, 2019 low. We don’t like selling the Index and expect short term dips to continue finding support in 3, 7, or 11 swing against 1676.41 pivot low in the first degree and against January 8, 2020 low (1627.3) in second degree.
