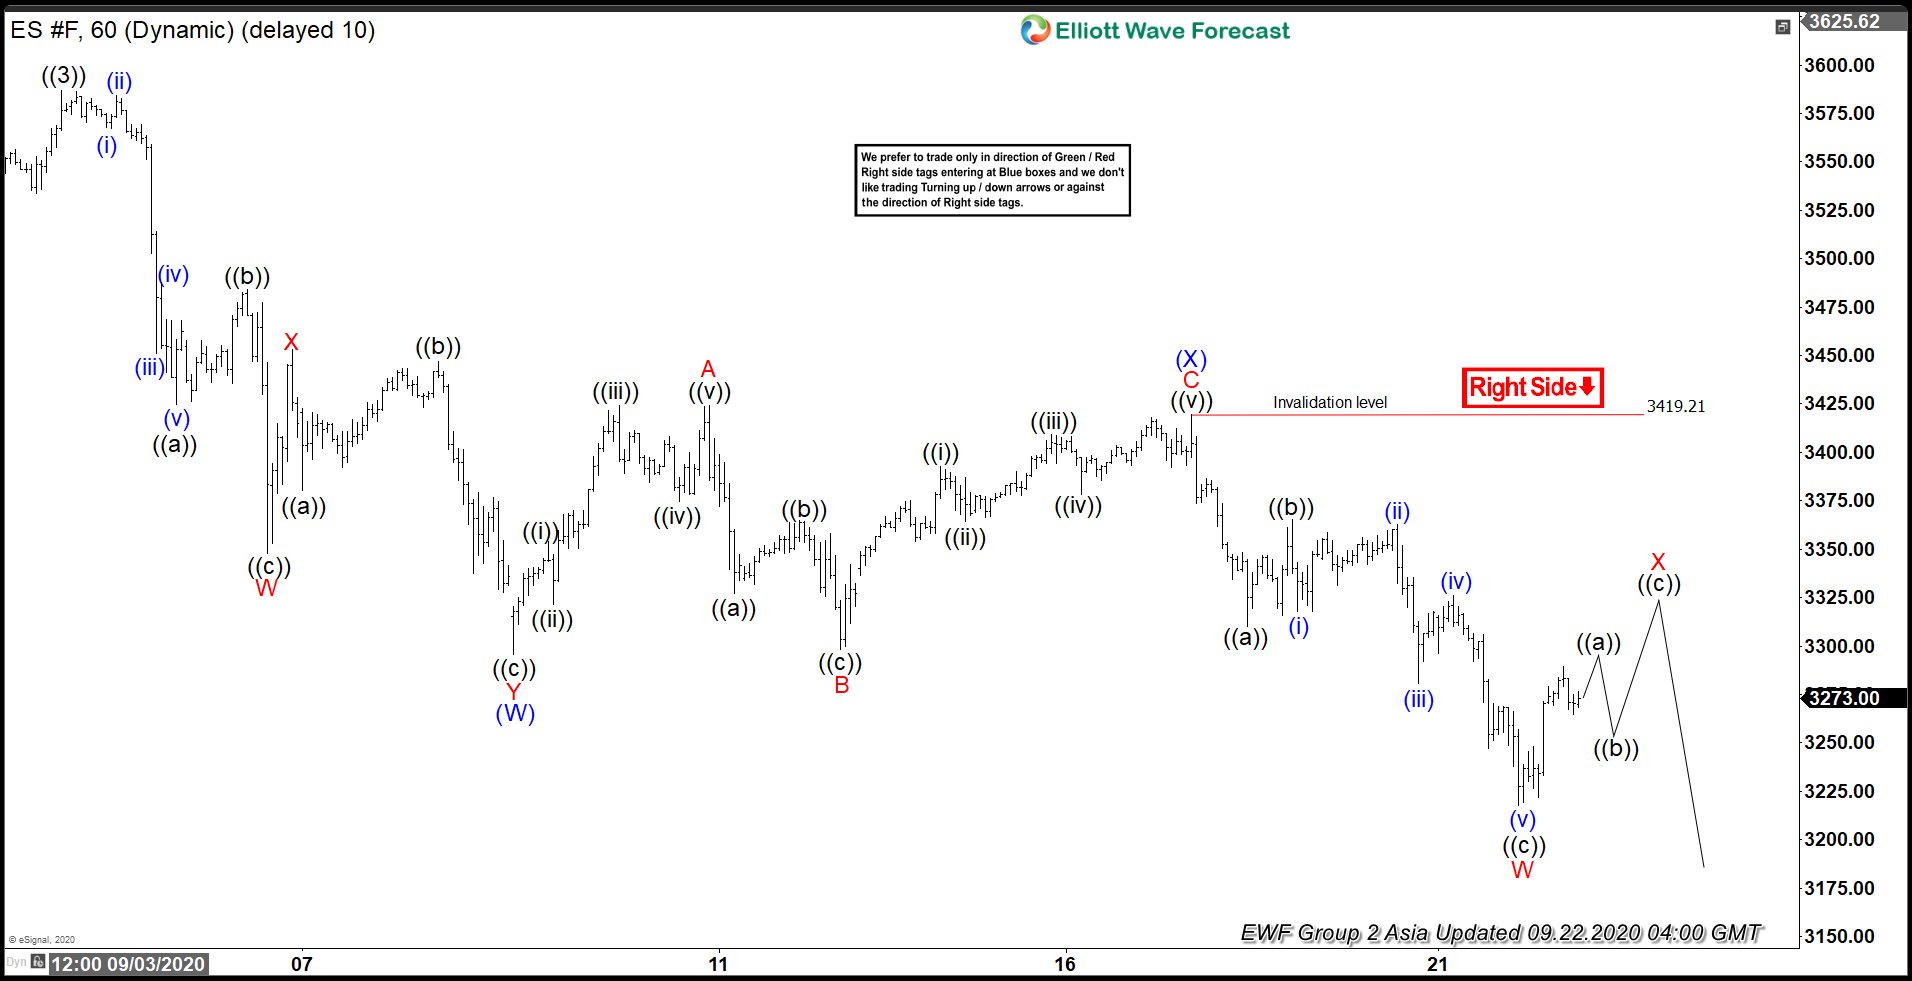
Elliott Wave View of S&P 500 E-mini Futures (ES) suggests the Index ended the cycle from June 15 low as wave ((3)) at 3587 high. From there, Index has extended lower to correct that cycle. The correction is unfolding as a double three Elliott Wave Structure. Down from wave ((3)) high, wave W ended at 3347.75 low. Wave X bounce ended at 3453.25 high. Index then resumed lower in wave Y, which ended at 3295.50 low. This also ended wave (W) in higher degree. Afterwards, Index bounced higher in wave (X). The subdivision unfolded as a flat correction, where wave A ended at 3424.25 high and wave B ended at 3298.25 low. The rally higher in wave C ended at 3419.21 high, which also ended wave (X) in the higher degree.
Since then, Index has resumed lower in wave W, which ended at 3217.75 low. The decline broke below previous wave (W) low, confirming that next leg lower in wave (Y) has already started. Currently, Index is doing a bounce in wave X, which will be followed by push lower in wave Y to end wave (Y) in higher degree. While below 3419.21 high, bounce in 3,7 or 11 swings is expected to fail for more downside. The 100-161.8% extension area of wave (W)-(X) where wave (Y) can potentially end is at 2945.50-3126.66. If reached, that area should see buyers appear to resume the rally or 3 waves bounce at least.
ES 1 Hour Elliott Wave Chart