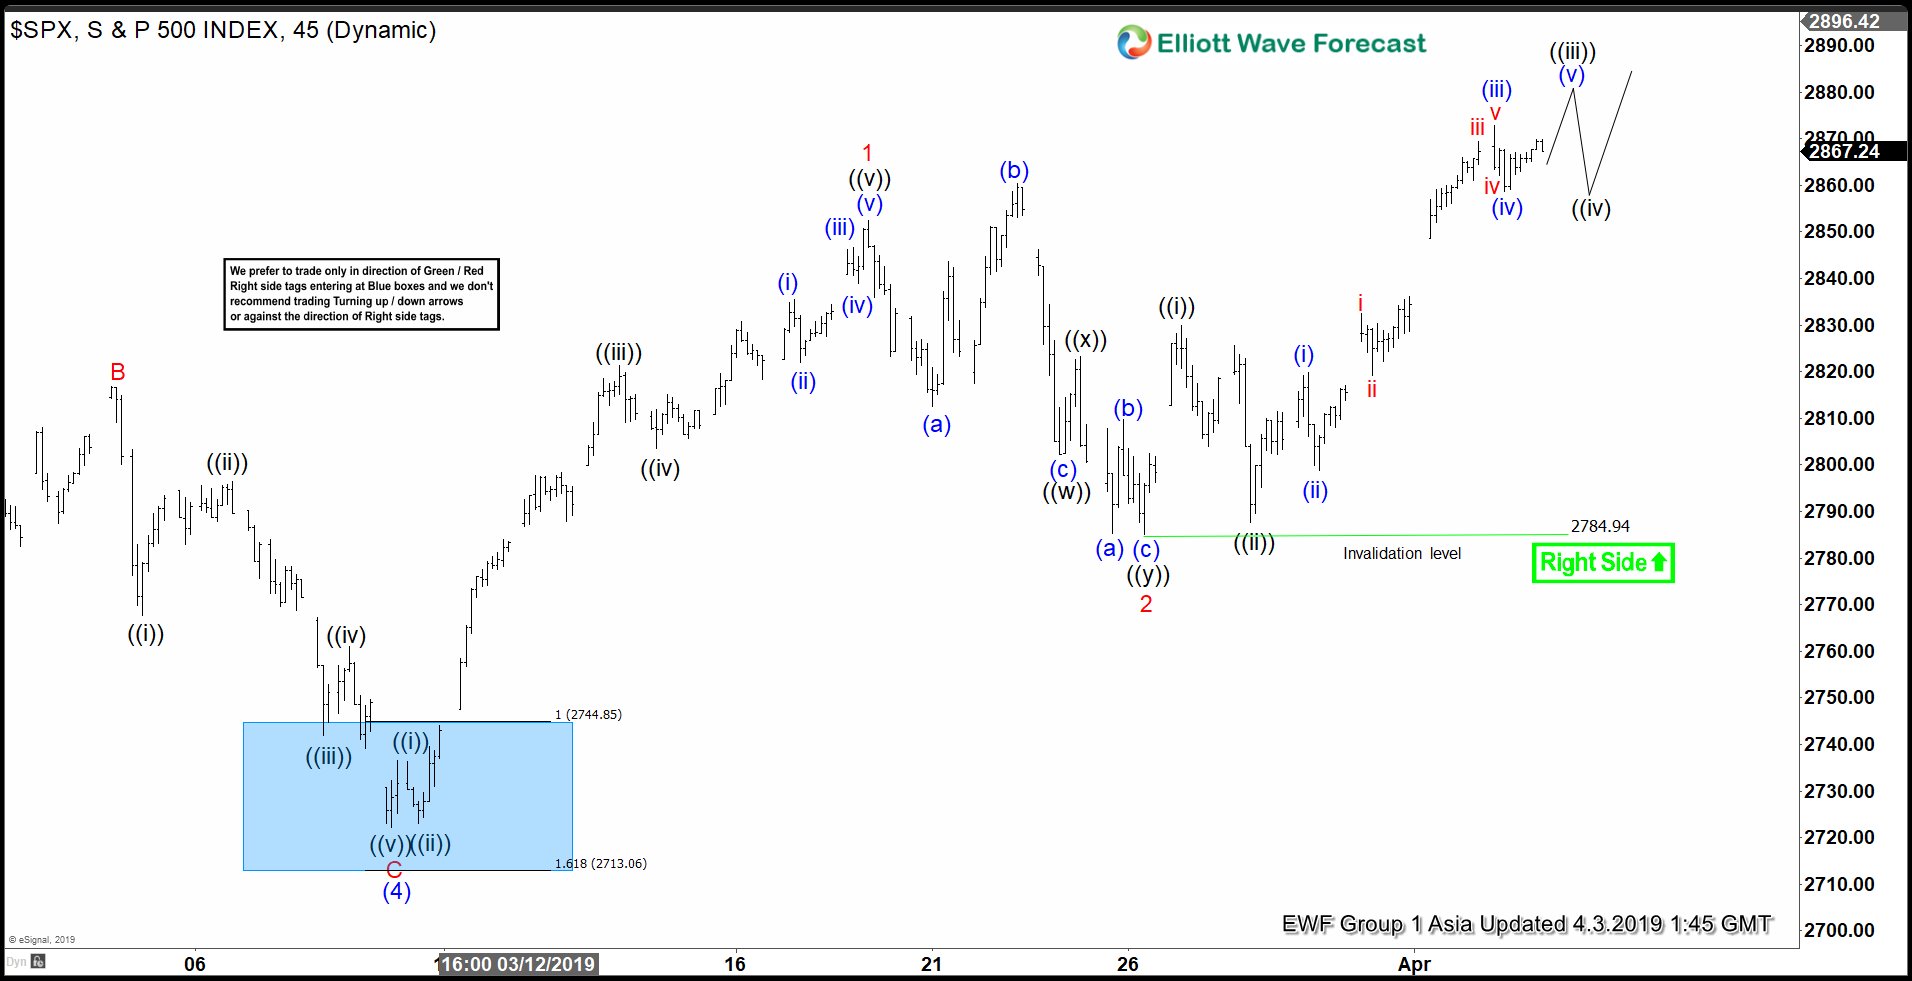
Cycle from Dec 26, 2018 low in S&P 500 (SPX) remains in progress as an impulse Elliott Wave structure. In the 1 hour chart below, we can see wave (4) of this impulsive move ended at 2722.27. The Index has resumed higher in wave (5) with subdivision also as an impulse of lesser degree. Up from 2722.27, wave 1 ended at 2852.42 and wave 2 ended at 2785.02.
Wave 1 subdivides as an impulse where wave ((i)) ended at 2736.25 and wave ((ii)) ended at 2723.02. Up from there, wave ((iii)) ended at 2821.24, wave ((iv)) ended at 2803.46, and wave ((v)) of 1 ended at 2852.42. Wave 2 pullback unfolded as double three Elliott Wave structure where wave ((w)) ended at 2802.13, wave ((x)) ended at 2823.28, and wave ((y)) of 2 ended at 2785.02. Wave 3 rally is currently in progress as an impulse. Near term, while dips stay above 2784.94, expect Index to extend higher. We don’t like selling the proposed pullback.
1 Hour SPX Elliott Wave Chart
