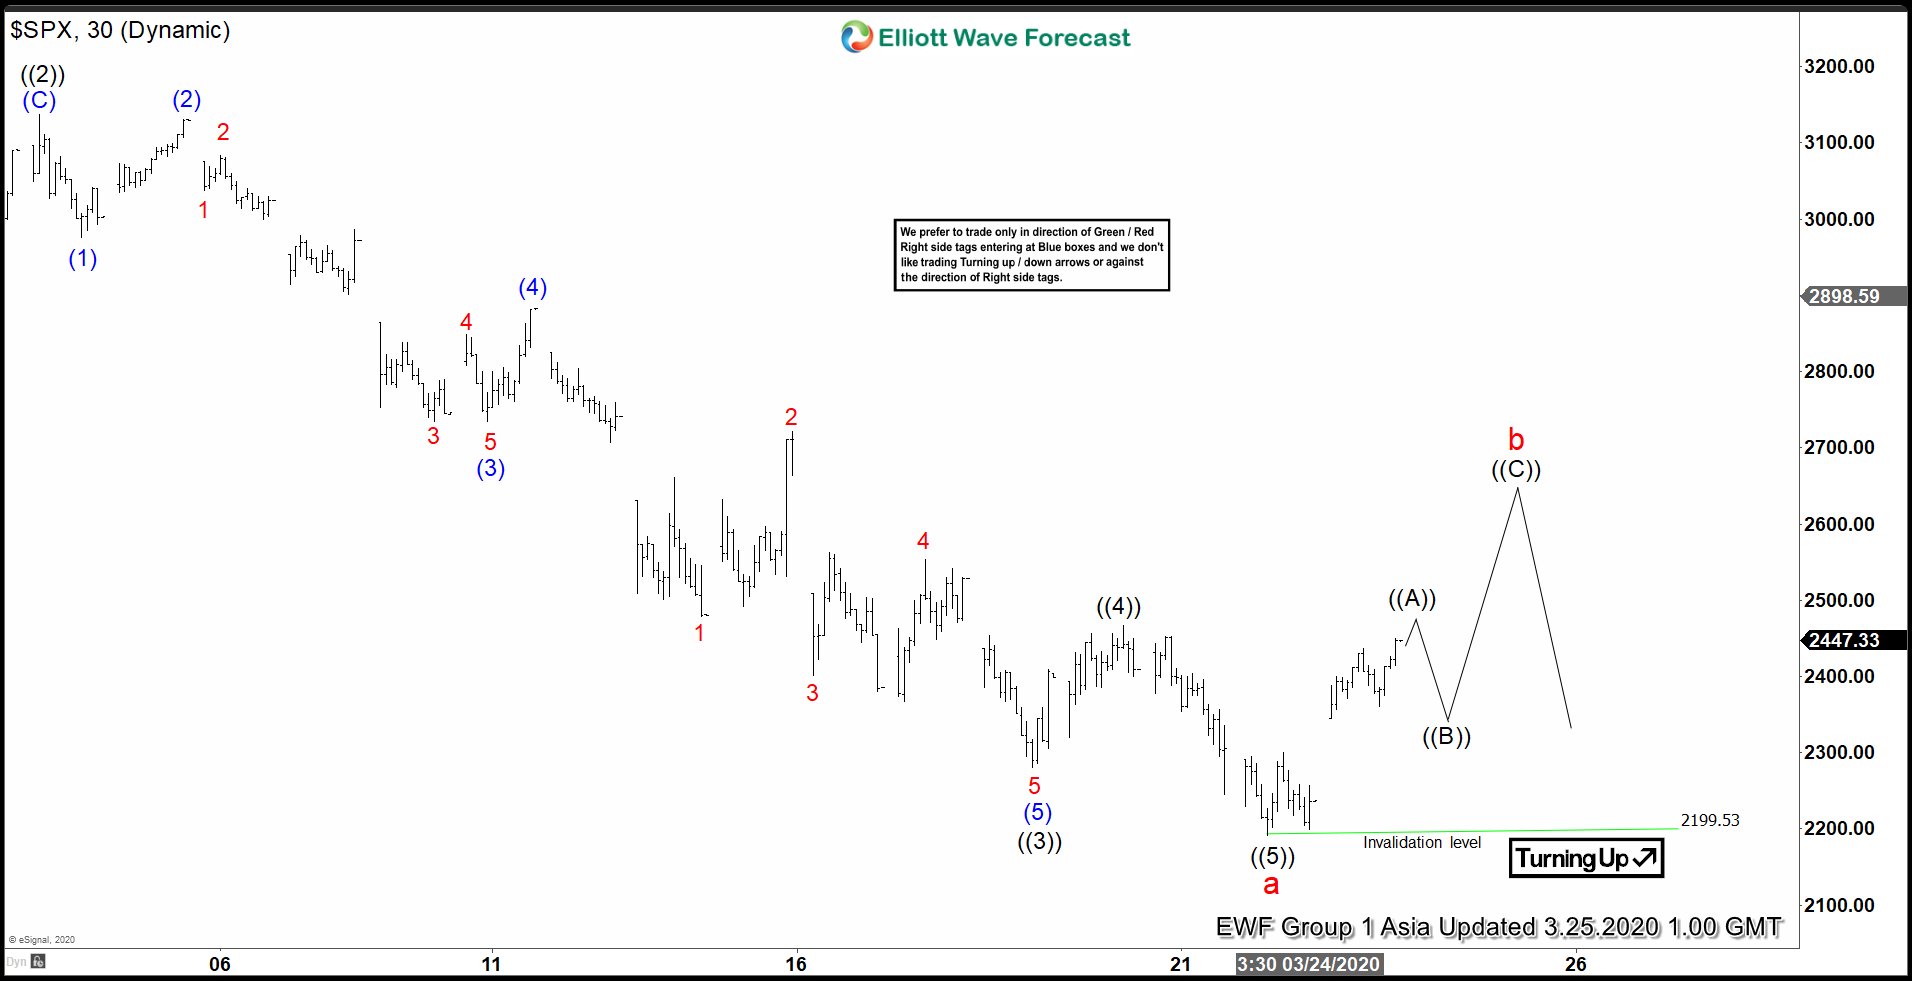
Short Term Elliott Wave view in S&P 500 (SPX) suggests that cycle from February 20, 2020 high has ended at 2199.5 low as wave a. Internal of wave a unfolded as a 5 waves impulse Elliott Wave structure. Down from February 20 high, wave ((1)) ended at 2855.84 and wave ((2)) bounce ended at 3136.72. The Index then resumed lower in wave ((3)) towards 2280.52 with internal also unfolding as 5 waves in lesser degree.
Down from wave ((2)) at 3136.72, wave (1) of ((3)) ended at 2976.63 and wave (2) of ((3)) bounce ended at 3130.97. Wave (3) of ((3)) ended at 2734 and correction in wave (4) of ((3)) ended at 2882.59. Final move wave (5) of ((3)) ended at 2280.52. Index then corrected in wave ((4)) which ended at 2466.97. Finally, wave ((5)) of a is proposed complete at 2199.5.
SPX has started to recover and the initial rally looks to be unfolding as a 5 waves which should end wave ((A)). It should then pullback in wave ((B)) before turning higher again 1 more leg in wave (©) of b. Near term, while pullback stays above 2199.5, expect the Index to extend higher at least 1 more leg.
S&P 500 (SPX) 1 Hour Elliott Wave Chart