Short term Elliott Wave View in Silver (XAGUSD) suggests that cycle from August 7 peak is unfolding as a triple three Elliott Wave structure . In the 60 minutes chart below, the metal ended wave ((X)) ((X)) at $25.57. Silver is proposed to have started wave ((Z)) lower with the internal of a zigzag (A)-(B)-©.
The 5 waves move lower from wave ((X)) ((X)) below is then internal of wave (A) zigzag. Down from $25.57, wave ((i)) ended at $24.75 and bounce in wave ((ii)) ended at $25.25. The metal extended lower in wave ((iii)) towards $23.85, wave ((iv)) ended at $24.63, and wave ((v)) ended at $23.5. This 5 waves lower completed wave 1 of (A). Bounce in wave 2 ended at $25.28 as a double zigzag. Wave ((w)) ended at $24.97, wave ((x)) ended at $24.18, and wave ((y)) of 2 ended at $25.28. The metal has turned lower in wave 3 where wave ((i)) ended at $24.07 and wave ((ii)) bounce ended at $24.61. The metal has resumed lower in wave ((iii)) of 3 of (A). Near term, as far as pivot at $25.57 high stays intact, expect rally to fail in 3, 7, or 11 swing.
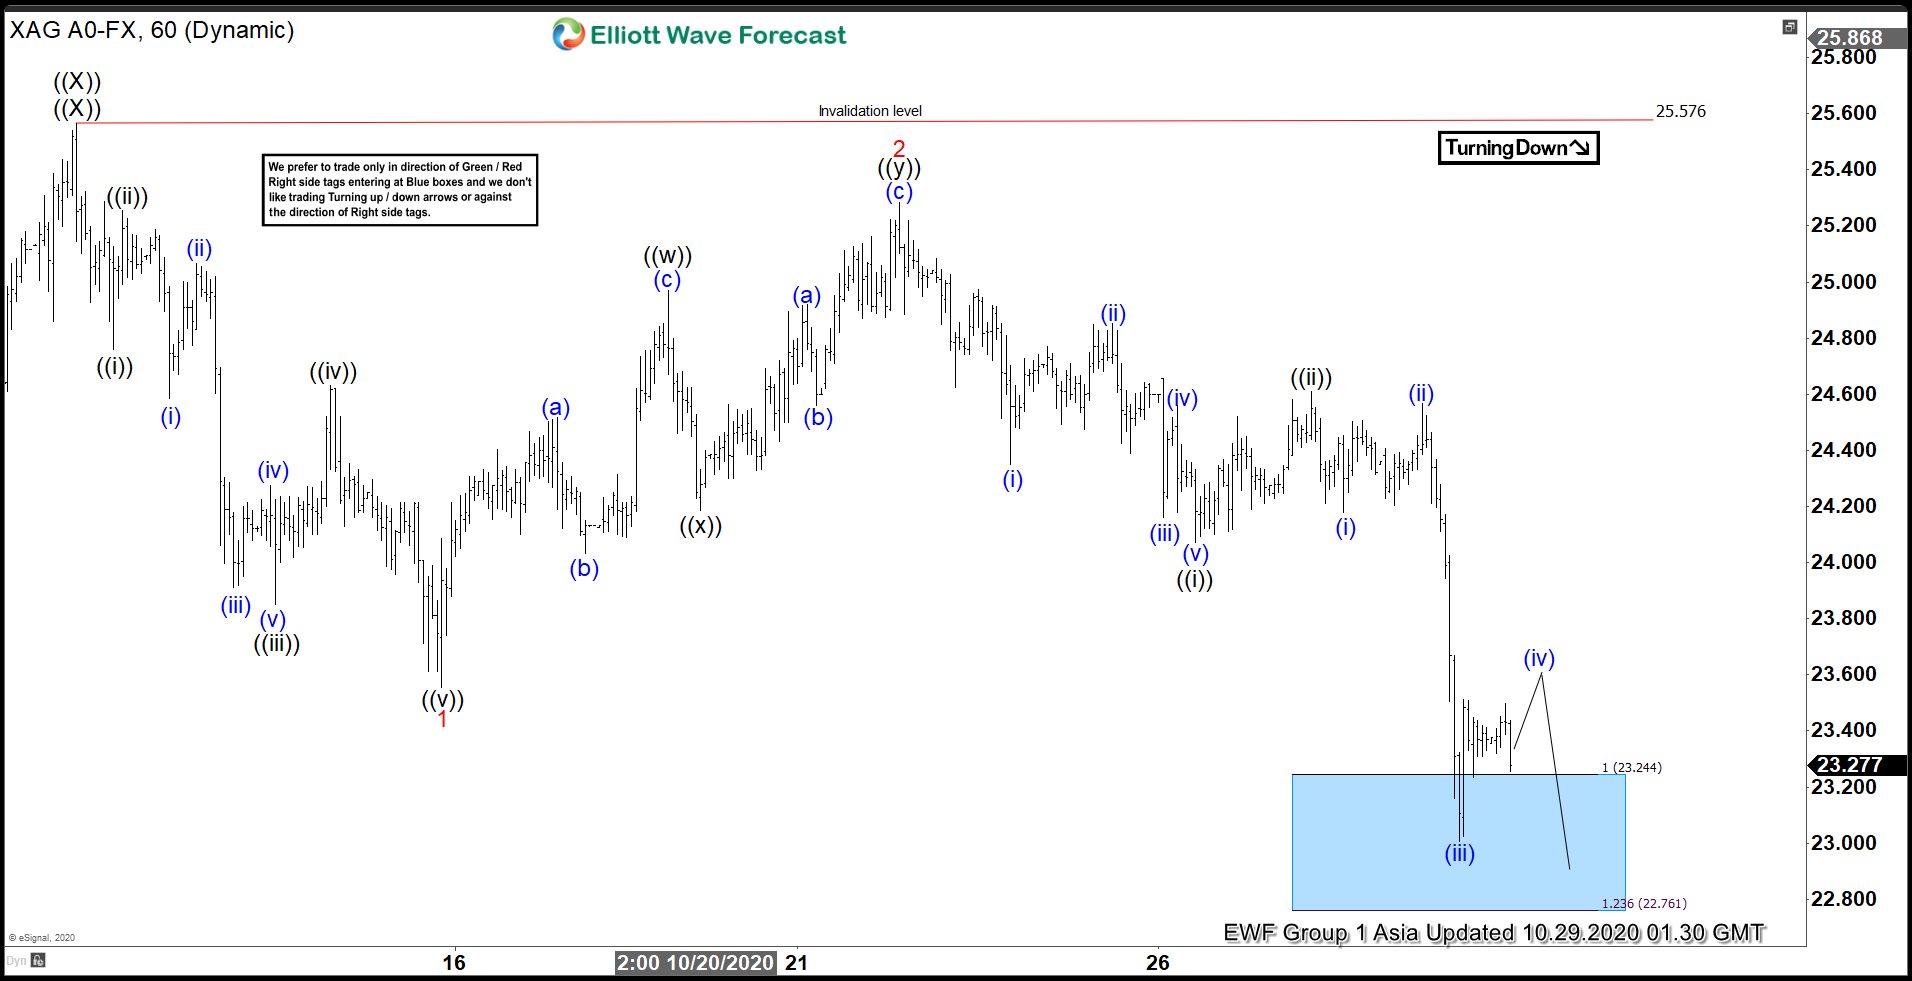
Silver (XAGUSD) 1 Hour Elliott Wave Chart