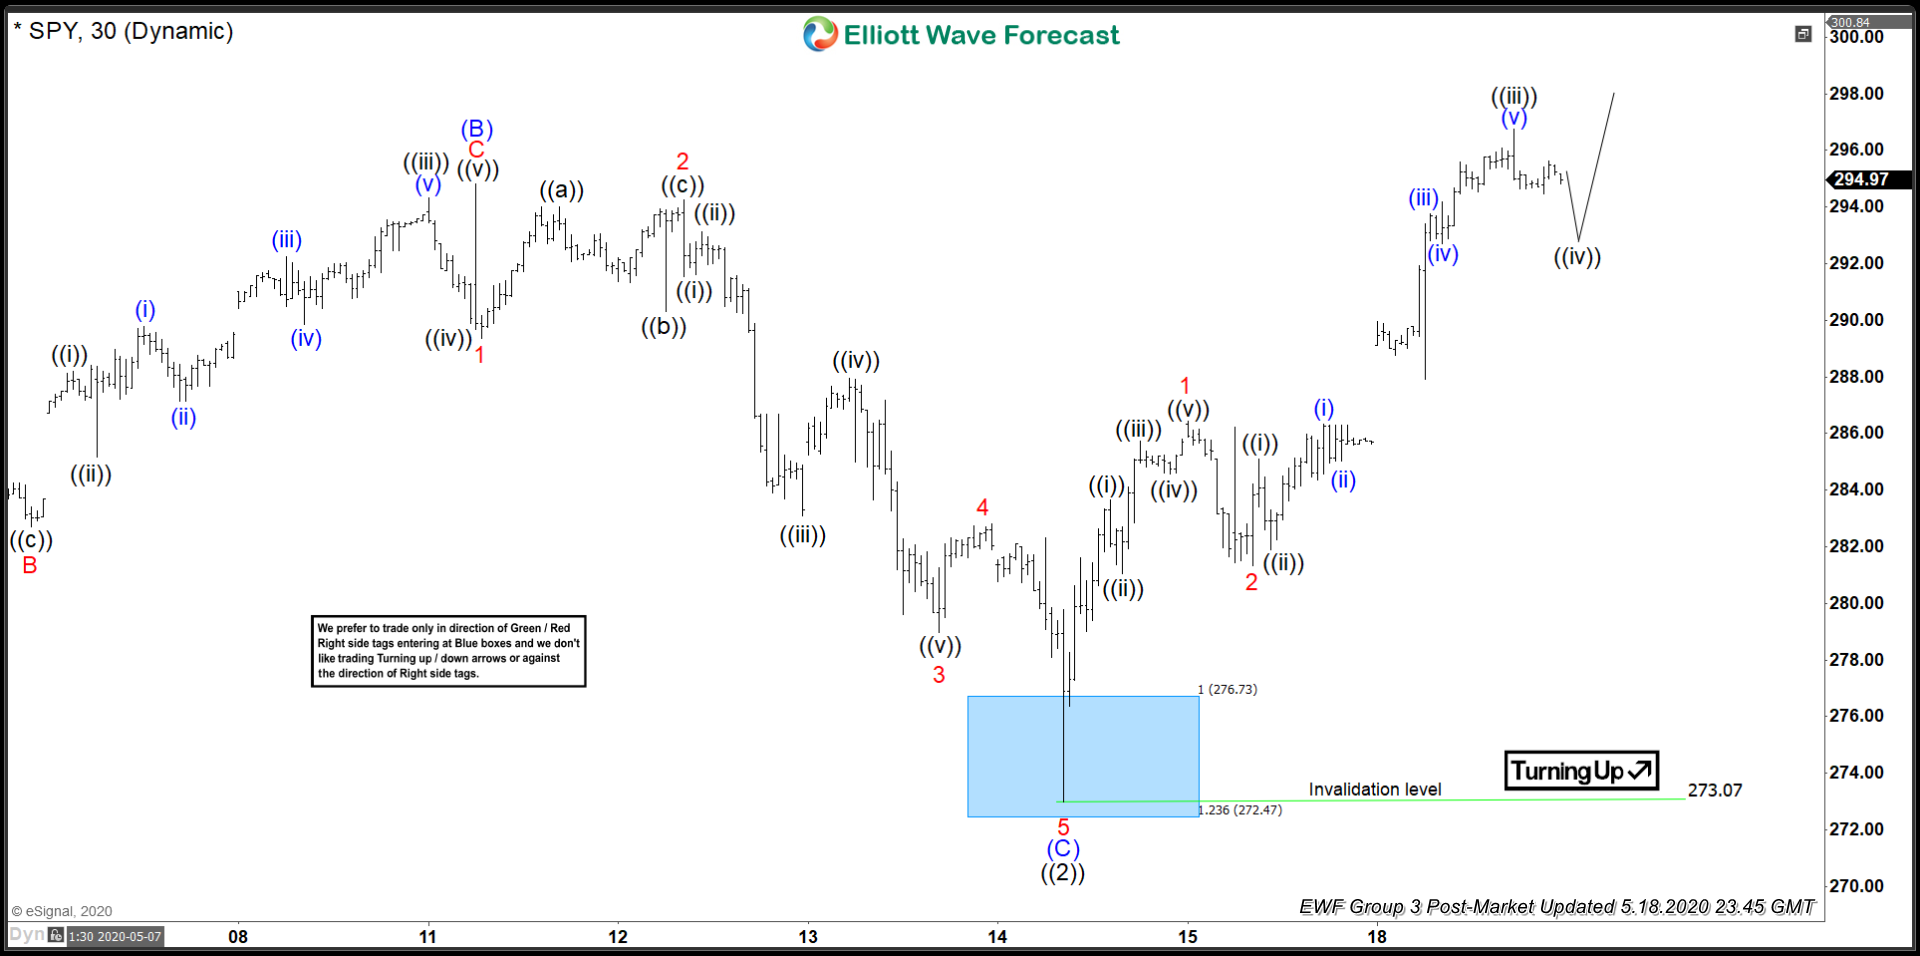
Short Term Elliott Wave view in SPY (S&P 500 ETF) suggests the rally from 3.23.2020 ended at 296.77 as wave ((1)). Pullback in wave ((2)) is proposed complete at 273.07 as the 30 minute chart below shows. The ETF still needs to break above wave ((1)) at 296.77 to confirm wave ((2)) has ended and creates a bullish sequence from 3.23.2020. Internal of wave ((2)) unfolded as a zigzag Elliott Wave structure. Wave (A) ended at 278.69, wave (B) ended at 294.8, and wave © ended at 273.07. Wave © ended at the blue box, which is 100% - 123.6% Fibonacci extension of wave (A). From there, the ETF has turned higher in wave ((3)) as an impulsive Elliott Wave structure.
Up from 273.07, wave 1 ended at 286.45 and wave 2 pullback ended at 281.34. Wave 3 remains in progress as an impulse in lesser degree. Up from wave 2 at 281.34, wave ((i)) ended at 285.08, wave ((ii)) ended at 281.89, and wave ((iii)) ended at 296.75. Expect wave ((iv)) pullback to find support while above 273.07 for more upside. As far as pivot at 273.07 low stays intact, expect dips to find support in 3, 7, or 11 swing for further upside.
SPY 1 Hour Elliott Wave Chart