Elliott Wave view in $DAX suggests that the cycle from December 27, 2018 low remains incomplete and ideally reaches 13652 - 14217 area. As a result, the Index can still see further upside and dips can continue to find support. Short term Elliott Wave chart below suggests the decline to 12889.7 on December 10, 2019 ended wave 4 and Index has resumed higher in wave 5. Up from 12889.74, wave (i) rally ended at 13219.03 and pullback in wave (ii) ended at 13105.07.
Index then resumed higher in wave (iii) towards 13423.4 and pullback in wave (iv) ended at 13255.55. Final leg wave (v) ended at 13398.34 which also completed wave ((i)) of 5 in higher degree. Index is currently correcting cycle from December 10, 2019 low within wave ((ii)) as a Flat Elliott Wave structure before the rally resumes. A Flat is labelled as ABC with subdivision of 3-3-5. Down from 13398.34, wave (a) ended at 13140.22 as 3 waves. Wave (b) bounce ended at 13381.44 also as 3 waves. Wave © lower is in progress as 5 waves and can reach 12919.2 - 13096.1 before buyers appear. We don’t like selling the Index and expect buyers to appear from the above area for more upside or 3 waves bounce at least.
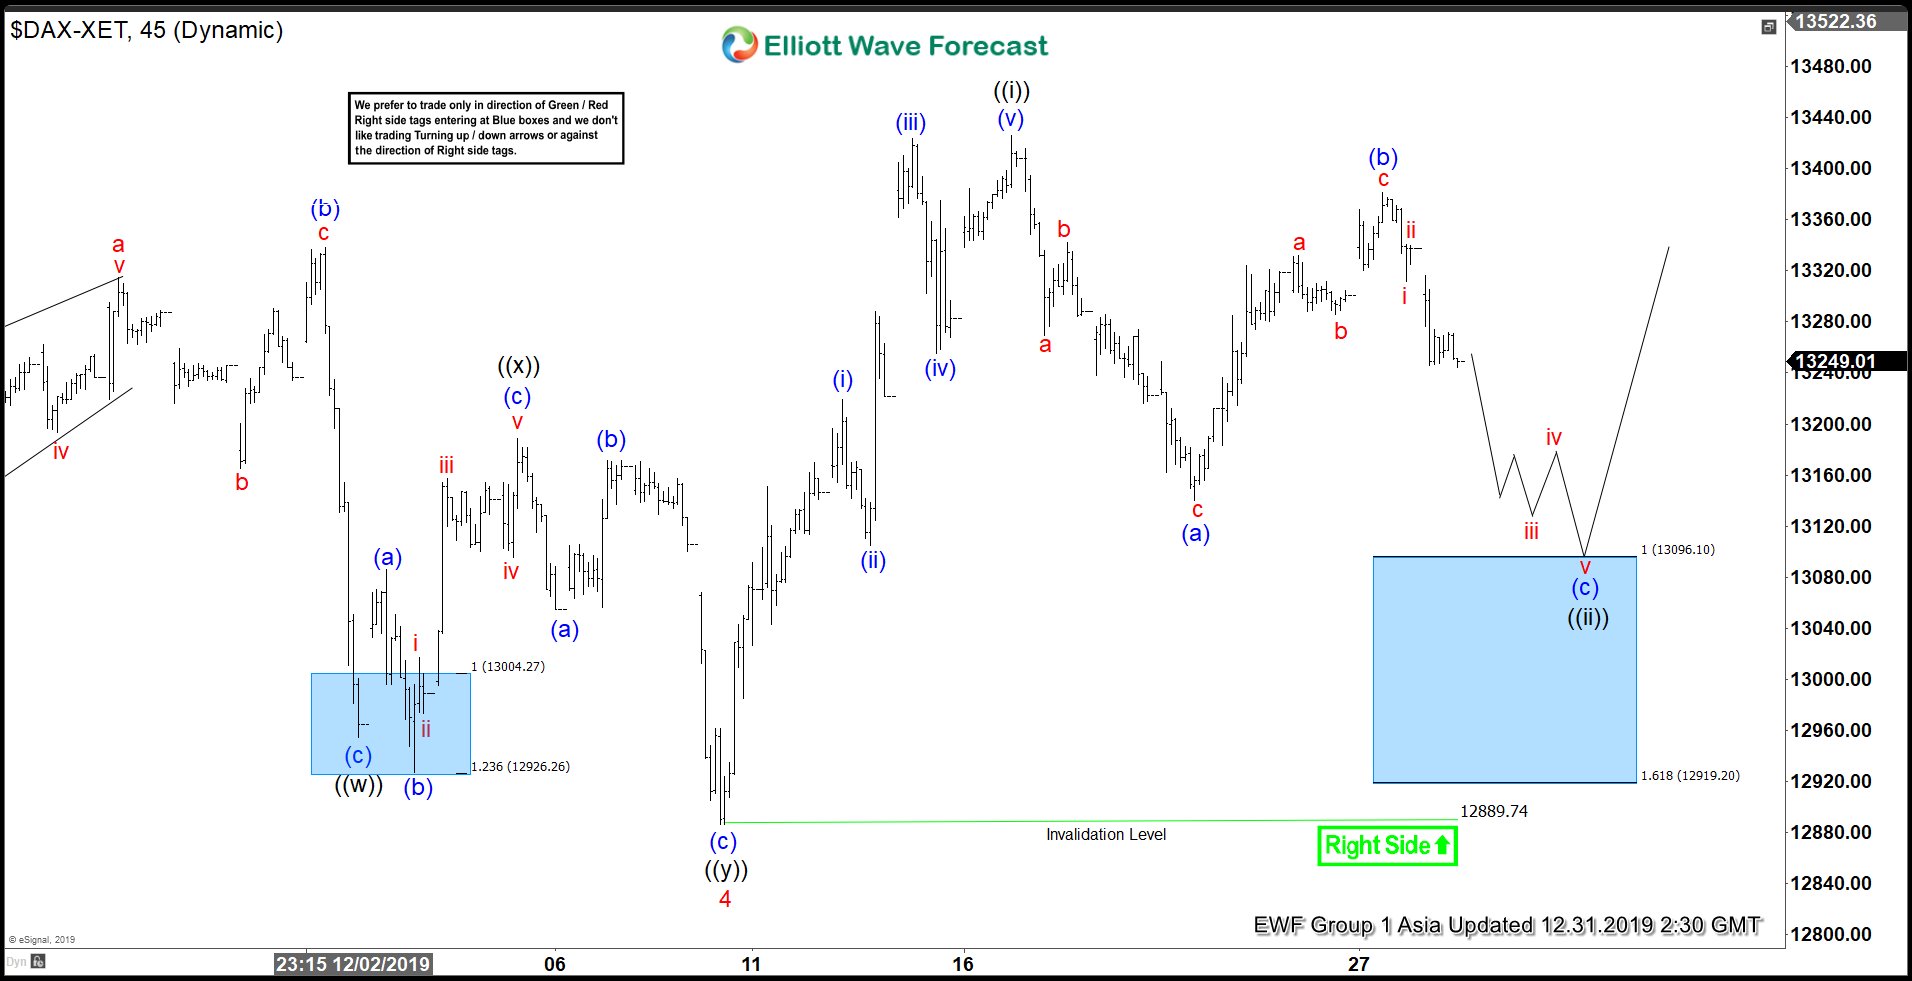
$DAX 1 Hour Elliott Wave Chart