Oil has found its bottom in April 2020. From the lows, it is extending higher and should become even more expensive in the coming years. Similarly, indices have found an important bottom in March 2020. From the lows, world indices like S&P500 and Nikkei have managed to break to new all-time highs. The mighty Energy Sector, by contrast, seems still to be lagging relatively to both indices and oil. Is it just lagging? Or maybe it has not found the long-term bottom yet?
Back in March, we have seen a French Supermajor Total reaching the extreme area 22.83-14.97. However, the internal structure of the pattern has suggested that another marginal lows still can happen. Now, lets take a look on another two Supermajors: Italian ENI and British BP. These may provide a clue in locating the important bottom in the Energy Sector.
Energy Supermajor Eni Monthly Elliott Wave Analysis 11.17.2020
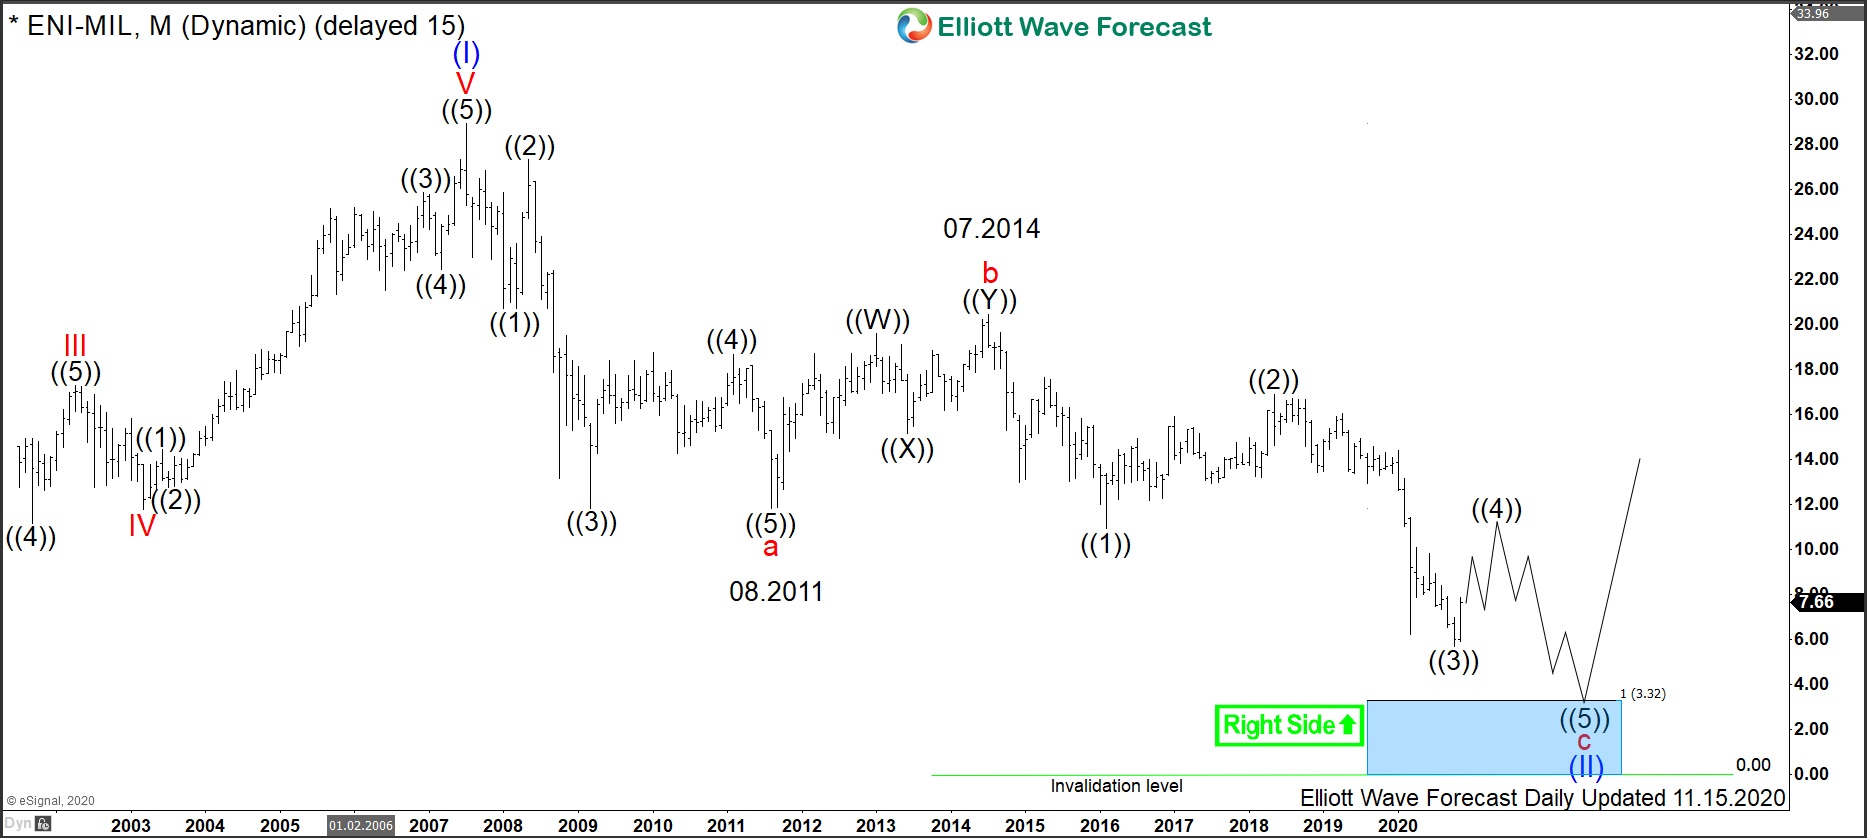
Monthly chart below shows the Eni stock $ENI at Italian Bourse in Milan. From the all-time lows, first, it has developped a cycle higher in wave (I) of super cycle degree. $ENI has printed the all-time highs in 2007.
A correction lower is unfolding as a an an Elliott Wave Zigzag pattern being 5-3-5 structure. First, impulse in red wave a lower has ended on 08.2011. Then, red wave b higher has topped on 07.2014. From there, 5 waves lower of red wave c may be still in progress towards the equal legs extension area 3.32 and even lower.
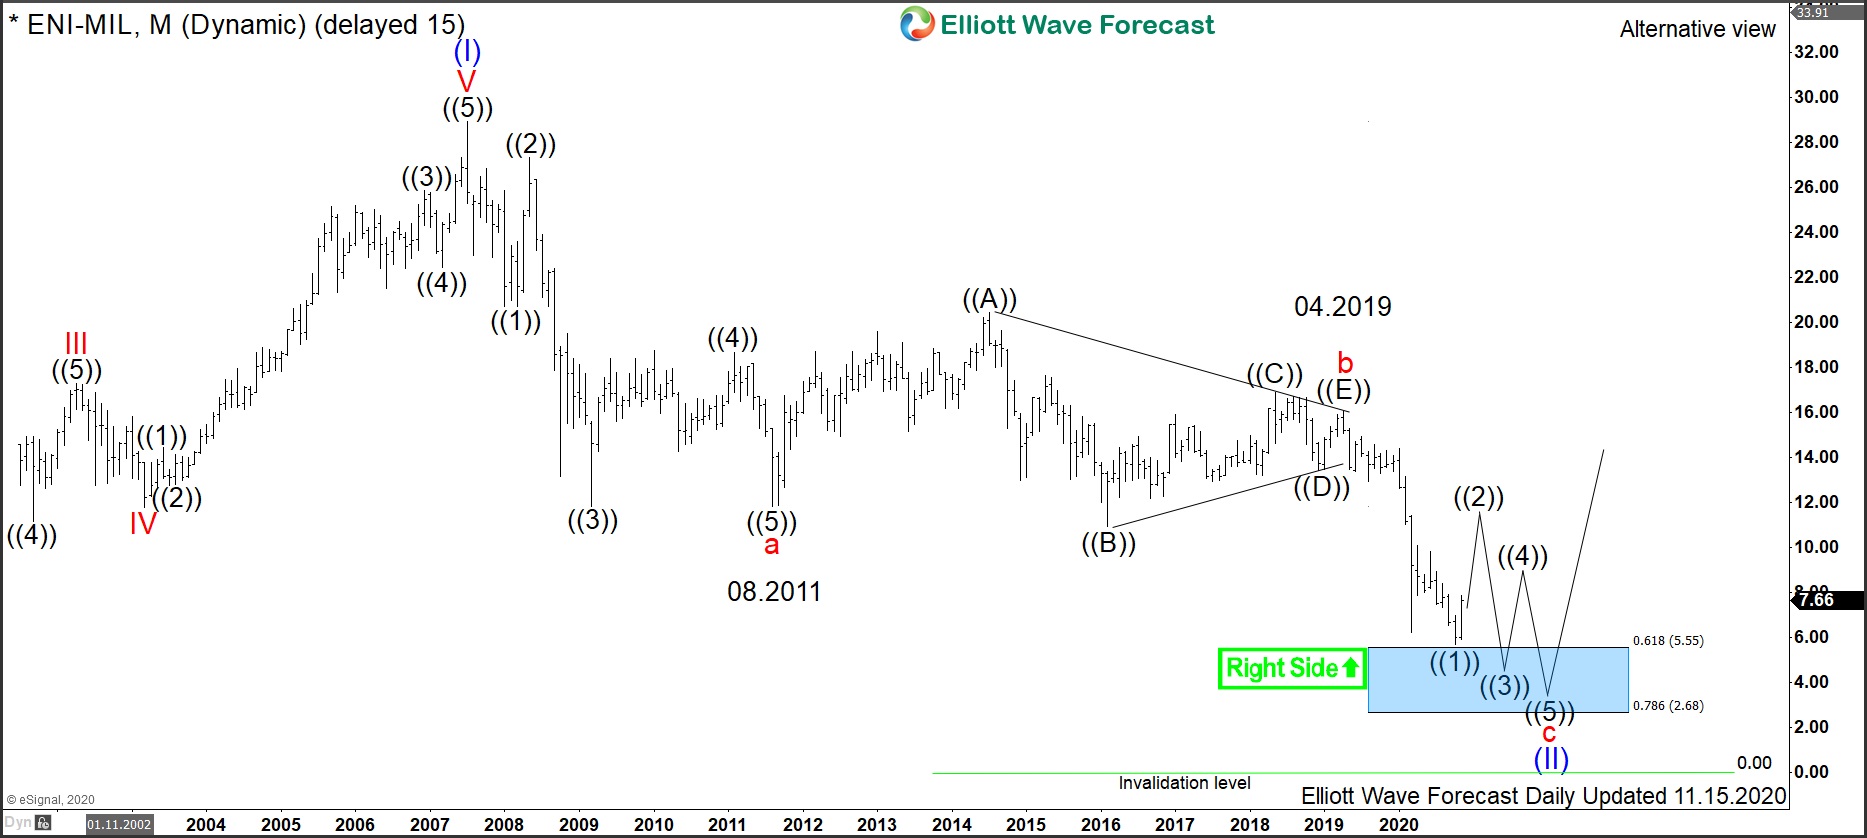
An alternative view presents a converging triangle in red wave b. Such triangles demonstrate both a converging price action and a converging RSI indicator reading. In such a case, triangle in wave b can be seen accomplished as late as 04.2019. In terms of the cycles correlation, the stock of Total $FP supports that view. Indeed, red wave b in $FP has ended on 09.2018.
Now, the thrust lower in red wave c can hardly extend towards equality with the wave a. As a matter of fact, the stock price cannot become negative. However, at least a 0.618-0.786 area as a target should be reached in 5 waves lower. The pattern of wave c looks incomplete and two new lows can still take place reaching towards 5.55-2.68 area.
Energy Supermajor BP Monthly Elliott Wave Analysis 11.17.2020
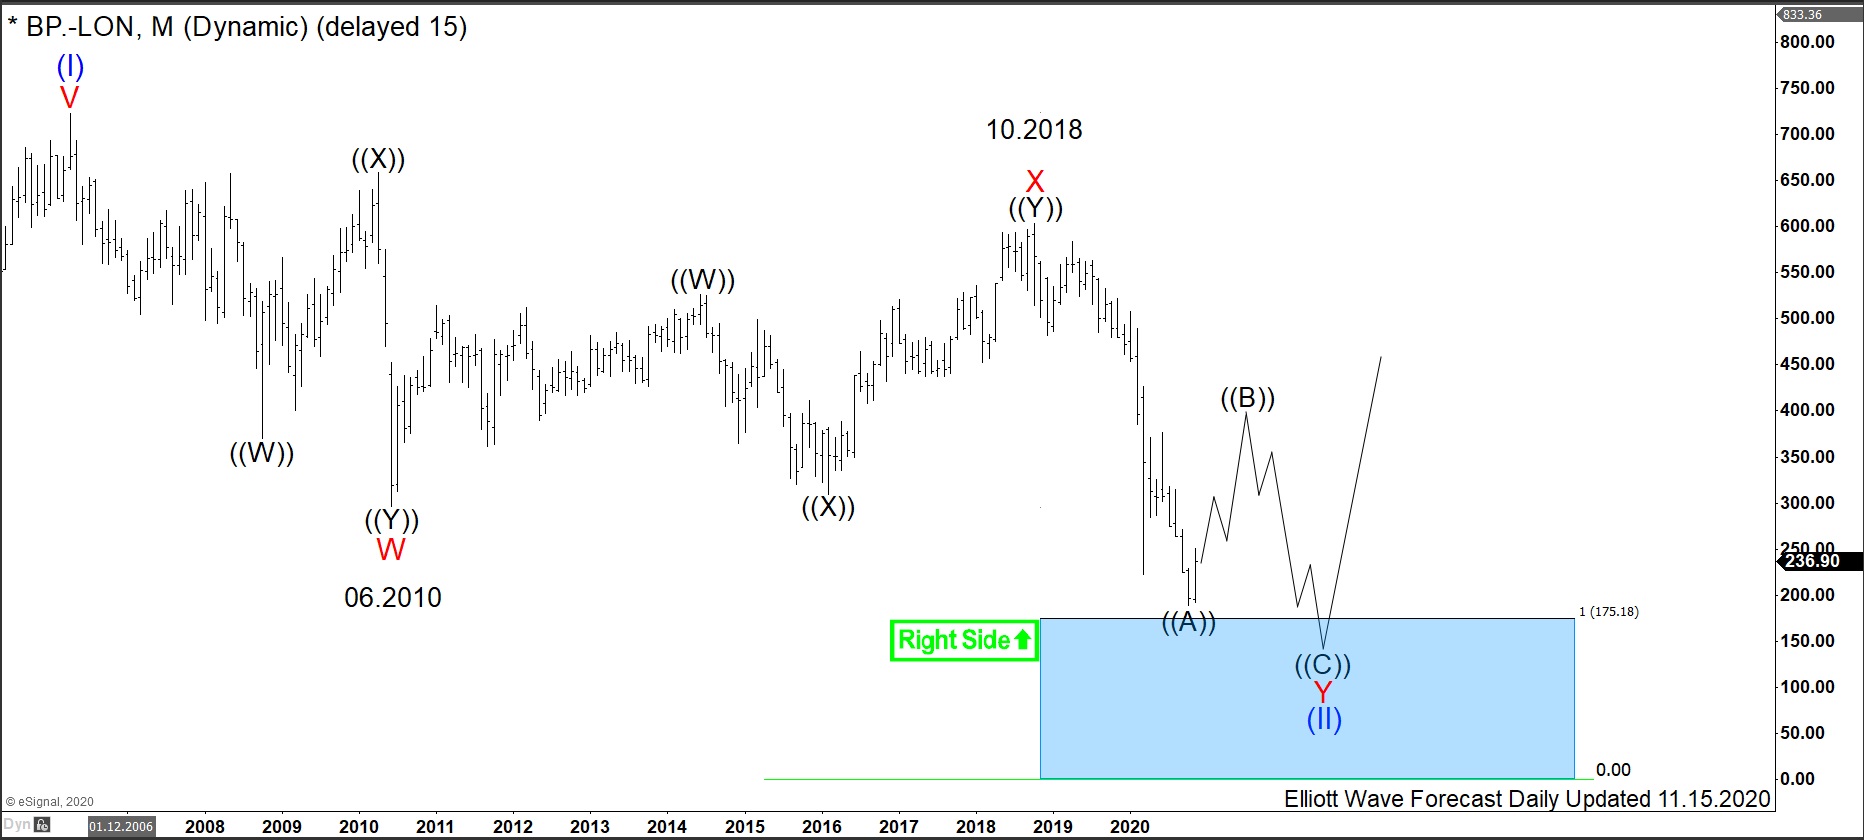
Monthly chart below shows the BP stock $BP. at London Stock Exchange. From the all time lows, it has printed the all-time highs in 2006, one year before Total and Eni did.
A correction lower is unfolding as an Elliott Wave Double Three pattern being a 3-3-3 structure. First, three waves in red wave w lower have ended on 06.2010. Then, red wave x higher has topped on 10.2018. From there, three waves lower of red wave y may be still in progress towards the equal legs extension area 175.18 and even lower.
Energy Sector Outlook
The patterns of three Supermajors Total, Eni and BP provide an idea that the bottom in Energy Sector is still to come. The lows of 2020 will be most probably revisited. Also, new lows could still take place. While French Total has reached the 22.83-14.97 extension area, it can revisit this area while setting new marginal lows. Italian ENI can still see one or two new lows towards 5.55-3.32 area. Also, British BP can break down in another swing towards 175.18 level and even lower. Only then, a long term bottom in Energy Sector can be set and a rally in wave (III) to new all-time highs can follow.