As the global energy landscape continues to evolve, EQT Corporation (NYSE: EQT) emerges as a key player in the realm of energy exploration and production.
EQT successfully completed a three-wave correction within the specified blue box area $29.8 - $20.5 , subsequently embarking on an upward trajectory. Since hitting a low of $28.11 on March 15, 2023, the stock surged by 60% within a dynamic and impulsive five-wave structure. The recent upward surge marked the completion of the initial wave I in August 2023 reaching a peak of $44.8, followed by an ongoing correction within wave II.
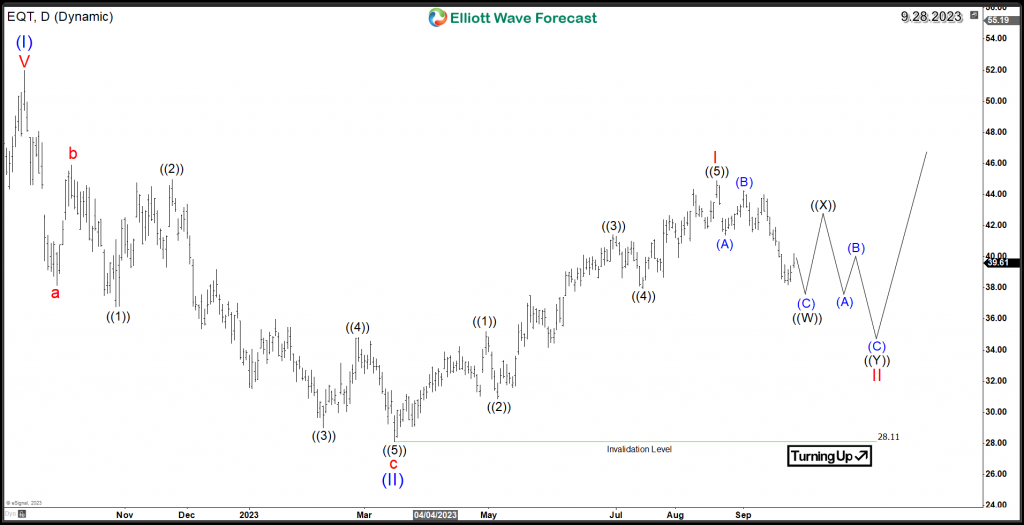
The present decline, which initiated from the August peak, is currently taking the form of a 3-swing structure. This is anticipated to conclude shortly, giving rise to two potential scenarios:
- The initial scenario shown in the following chart is based on the expected correlation with the broader stock market. Accordingly, it is expected that the reaction will be capped below $44.8, forming part of a wave ((X)). This will allow the stock to proceed within a corrective double-three structure, ultimately completing wave ((Y)) of II, while remaining above $28.11. Following the conclusion of the correction, EQT is anticipated to resume the upward trend that commenced earlier this year. The stock is poised for a robust rally in wave III, with the potential to surpass the 2022 peak of $51.97, thereby initiating the next weekly extension.
EQT Daily Chart 9.28.2023 ( 1st Scenario )
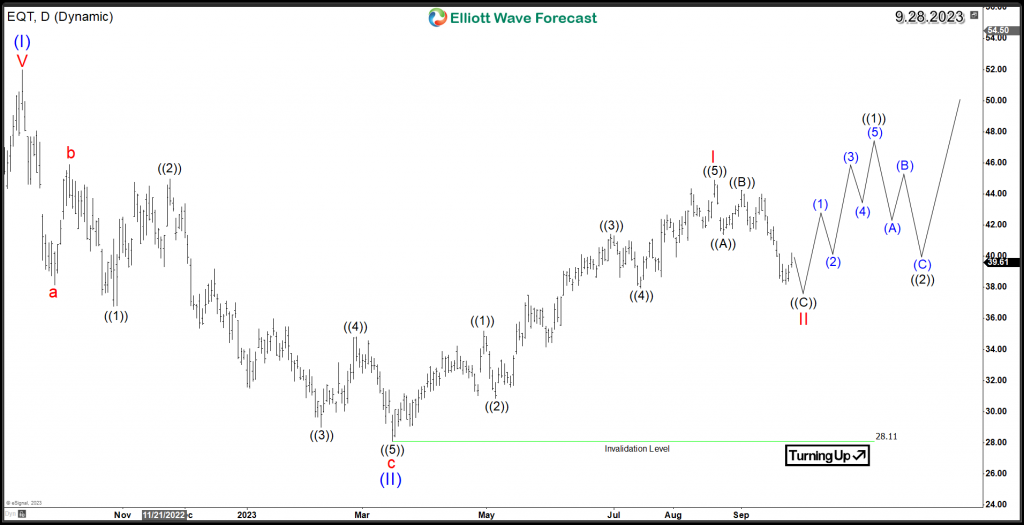
-The second scenario presents a more bullish perspective. If the ongoing decline is deemed a corrective phase, it could signify the completion of wave II. In this scenario, the stock may embark on the next upward leg within wave III, marked by an impulsive rally within wave ((1)). Ideally, this rally should surpass the $44.8 peak, thereby establishing a bullish sequence. Subsequently, the expected pullback in wave ((2)) would likely find support and generate buying interest, facilitating a higher high and higher low sequence as the stock continues its ascent within the daily uptrend.
EQT Daily Chart 9.28.2023 ( 2nd Scenario )
In conclusion, EQT’s potential scenarios remain well-aligned with the daily Elliott wave structure. The stock continues to offer promising investment opportunities, with the condition that pullbacks remain above the key level of $28.11.

