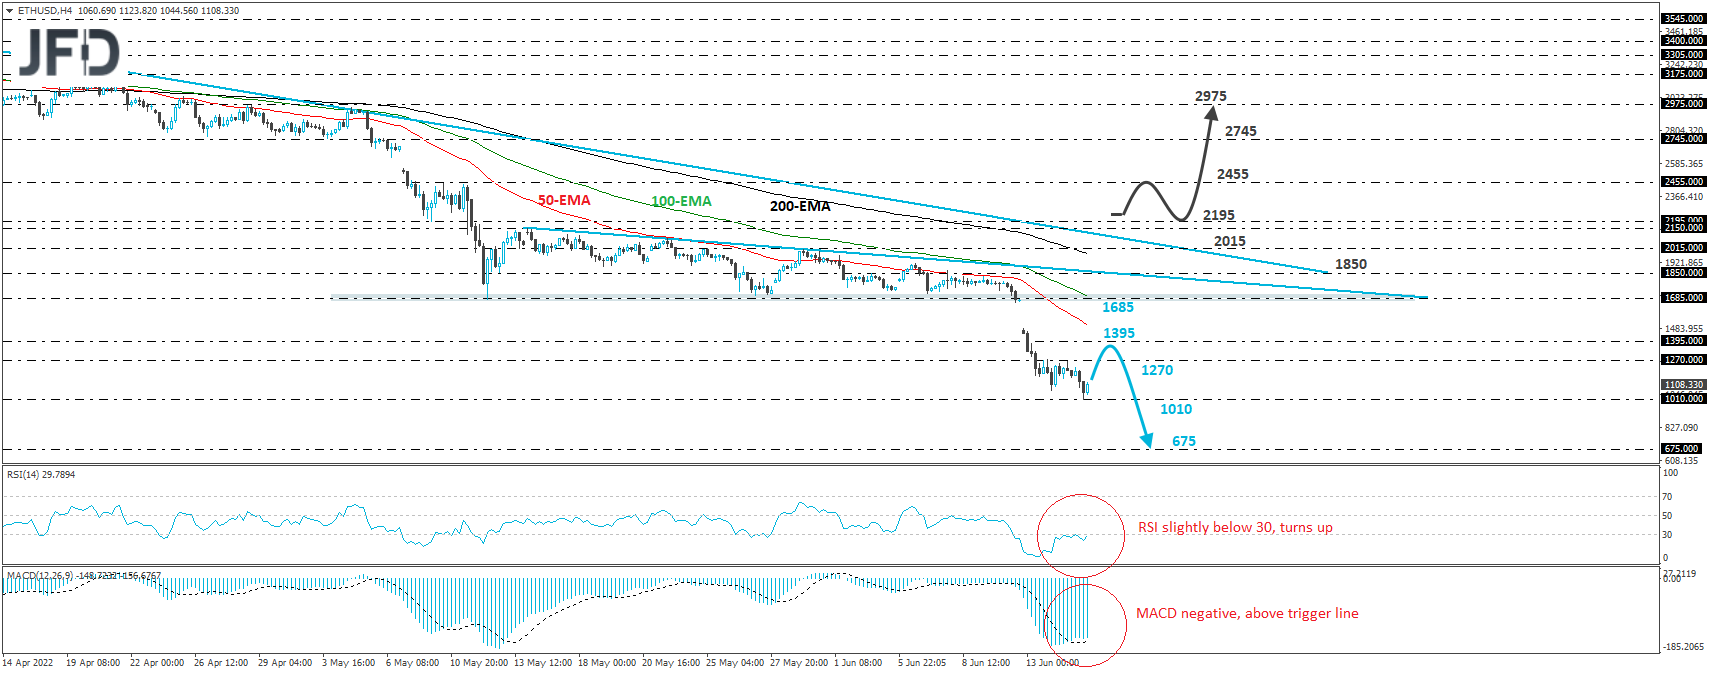
Last Friday, Ethereum opened with a large negative gap, breaking below the key support territory of 1685, which had been acting as a floor since May 12th. Subsequently, the crypto kept drifting south, and today, it hit support at 1010, before rebounding somewhat. Overall, Ethereum is trading well below the downside line drawn from the high of May 15th, and well below the downtrend line taken from the high of April 3rd. Thus, even if the price rebounds somewhat, we will see this as a corrective bounce before the next leg south.
We believe that the bears could take charge again from near the 1270 barrier, marked by the high of June 14th, or from near the 1395 territory, defined as a resistance by the inside swing low of March 1st. This could result in another leg south and another test near the 1010 line, the break of which would confirm a forthcoming lower low and may see scope for declines towards the 675 territory, defined as a support by the inside swing high of December 17th, 2020.
Shifting attention to our short-term oscillators, we see that the RSI lies within its below-30 zone, but it has moved higher and appears ready to poke its nose above that 30 line. The MACD, although deep into its negative territory, lies above its trigger line. Both indicators detect strong downside momentum, but one that has started to slow down. In our view, this adds credence to the case of a possible rebound before the next leg south.
A bullish reversal will be the case in our view, upon a break above 2195, marked by the inside swing low of May 10th. This may confirm the break above the downside line taken from the high of April 3rd and could initially pave the way towards the high of May 10th, at around 2455. If the bulls are not willing to stop there, then we may see them pushing towards the 2745 territory, which acted as a support between April 26th and May 3rd.
Disclaimer:
The content we produce does not constitute investment advice or investment recommendation (should not be considered as such) and does not in any way constitute an invitation to acquire any financial instrument or product. The Group of Companies of JFD, its affiliates, agents, directors, officers or employees are not liable for any damages that may be caused by individual comments or statements by JFD analysts and assumes no liability with respect to the completeness and correctness of the content presented. The investor is solely responsible for the risk of his investment decisions. Accordingly, you should seek, if you consider appropriate, relevant independent professional advice on the investment considered. The analyses and comments presented do not include any consideration of your personal investment objectives, financial circumstances or needs. The content has not been prepared in accordance with the legal requirements for financial analyses and must therefore be viewed by the reader as marketing information. JFD prohibits the duplication or publication without explicit approval.
CFDs are complex instruments and come with a high risk of losing money rapidly due to leverage. 72.99% of retail investor accounts lose money when trading CFDs with the Company. You should consider whether you understand how CFDs work and whether you can afford to take the high risk of losing your money. Please read the full Risk Disclosure.
Copyright 2022 JFD Group Ltd.