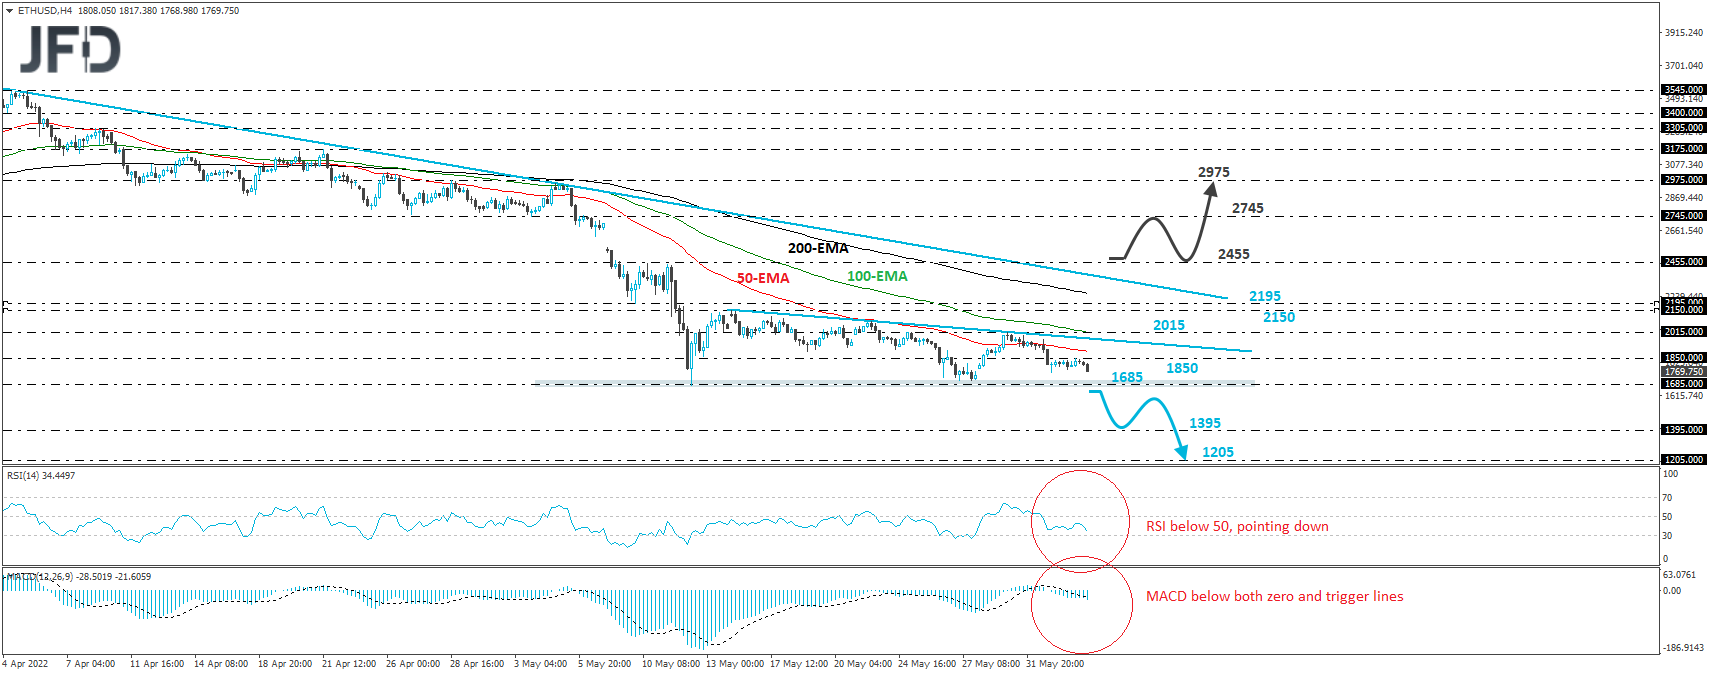
ETH/USD traded slightly lower today, after hitting resistance near the 1850 zone. However, although the crypto is trading below the downside resistance line drawn from the high of May 15th, it remains above the key support area of 1685, thereby forming a descending triangle pattern. That triangle is also below a longer-term downside line, drawn from the high April 3rd, and thus, we see more chances for the price to exit the triangle to the downside rather than to the upside.
A clear and decisive break below 1685 would confirm a forthcoming lower low on both the 4-hour and daily charts and may encourage the bears to push the action towards the 1395 territory, which provided support between February 23rd and March 1st, 2021. If they are not willing to stop there, then we may see them pushing towards the 1205 territory, marked by the low of January 22nd, 2021.
Shifting attention to our short-term oscillators, we see that the RSI, already below 50, turned down, while the MACD lies below both its zero and trigger lines, pointing south as well. Both indicators detect downside speed and add to the case of the crypto exiting the triangle through its lower bound.
Now in order to start examining whether the bulls have stollen all the bears’ swords we would like to see, not only a break above the upper bound of the triangle, but also a break above the aforementioned longer-term downside line, and the 2455 territory, marked by the high of May 10th. We could then see advances towards the 2745 barrier, marked by the inside swing lows of April 27th and May 3rd, the break of which could extend the gains towards the 2975 zone, marked by the highs of April 28th and May 4th.
Disclaimer:
The content we produce does not constitute investment advice or investment recommendation (should not be considered as such) and does not in any way constitute an invitation to acquire any financial instrument or product. The Group of Companies of JFD, its affiliates, agents, directors, officers or employees are not liable for any damages that may be caused by individual comments or statements by JFD analysts and assumes no liability with respect to the completeness and correctness of the content presented. The investor is solely responsible for the risk of his investment decisions. Accordingly, you should seek, if you consider appropriate, relevant independent professional advice on the investment considered. The analyses and comments presented do not include any consideration of your personal investment objectives, financial circumstances or needs. The content has not been prepared in accordance with the legal requirements for financial analyses and must therefore be viewed by the reader as marketing information. JFD prohibits the duplication or publication without explicit approval.
CFDs are complex instruments and come with a high risk of losing money rapidly due to leverage. 72.99% of retail investor accounts lose money when trading CFDs with the Company. You should consider whether you understand how CFDs work and whether you can afford to take the high risk of losing your money. Please read the full Risk Disclosure.
Copyright 2022 JFD Group Ltd.