EUR/JPY Technical Analysis Summary
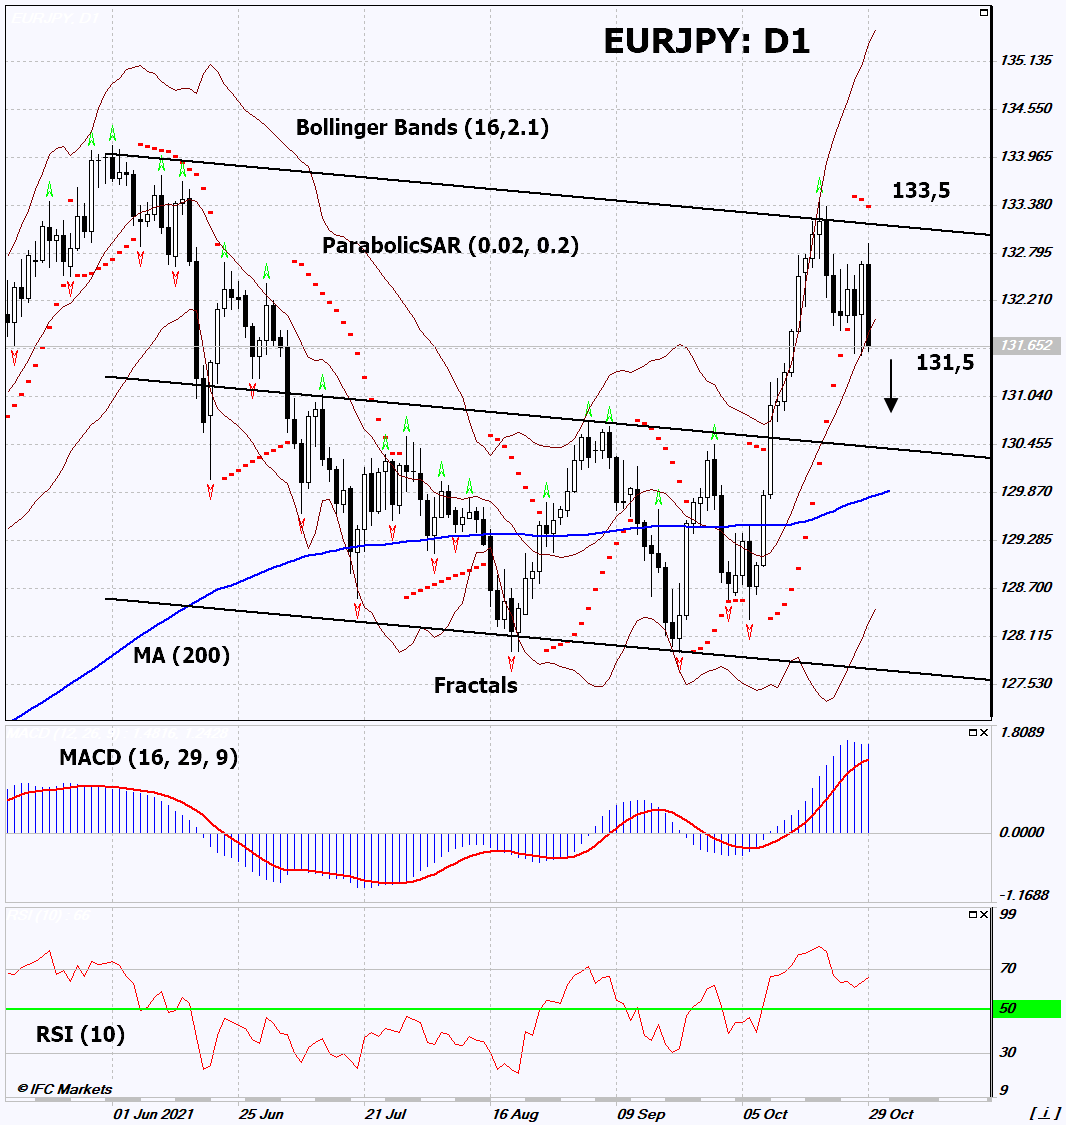
Sell Stop:Below 131,5
Stop Loss:Above 133,5
| Indicator | Signal |
|---|---|
| RSI | Neutral |
| MACD | Buy |
| MA(200) | Neutral |
| Fractals | Neutral |
| Parabolic SAR | Sell |
| Bollinger Bands | Neutral |
EUR/JPY Chart Analysis
EUR/JPY Technical Analysis
On the daily timeframe, EURJPY: D1 is correcting downward from the upper border of the descending channel. A number of technical analysis indicators have formed signals for further decline. We do not rule out a bearish movement if EURJPY falls below its last low: 131.5. This level can be used as an entry point. The initial risk limitation is possible above the last upper fractal and the Parabolic signal: 133.5. After opening a pending order, move the stop to the next fractal maximum following the Bollinger and Parabolic signals. Thus, we change the potential profit/loss ratio in our favor. The most cautious traders, after making a deal, can go to the four-hour chart and set a stop-loss, moving it in the direction of movement. If the price overcomes the stop level (133.5) without activating the order (131.5), it is recommended to delete the order: there are internal changes in the market that were not taken into account.
Fundamental Analysis of Forex - EUR/JPY
According to preliminary data for October, inflation in the European Union has noticeably increased. Will the EURJPY quotes continue to decline?
The downward movement means the strengthening of the Japanese yen versus the euro. According to preliminary data, the European Union Consumer Price Index (CPI) in October rose by 4.1% in annual terms. This is the highest increase since July 2008. Inflation data came out the next day after a regular meeting of the European Central Bank (ECB), at which it was announced that no rate hike (0%) and tightening of monetary policy were planned. Because of this, negative inflation data weakened the euro noticeably. For the first time since March 2020, EURUSD plunged more than 1% in one day. In turn, the Tokyo Consumer Price Index (CPI) for October was also published in Japan. This is the so-called Tokyo inflation, which often indicates the direction of inflation in the entire country. On an annualized basis, Tokyo CPI rose 0.1% in October. Bank of Japan (BoJ) rate is negative and amounts to -0.1%. It is close to the 0% ECB rate. At the same time, inflation in the European Union is much higher. In theory, this can affect the rate of the currency pair in question. Inflation for October will be released in Japan on November 18th. In September, it amounted to 0.2% in annual terms.