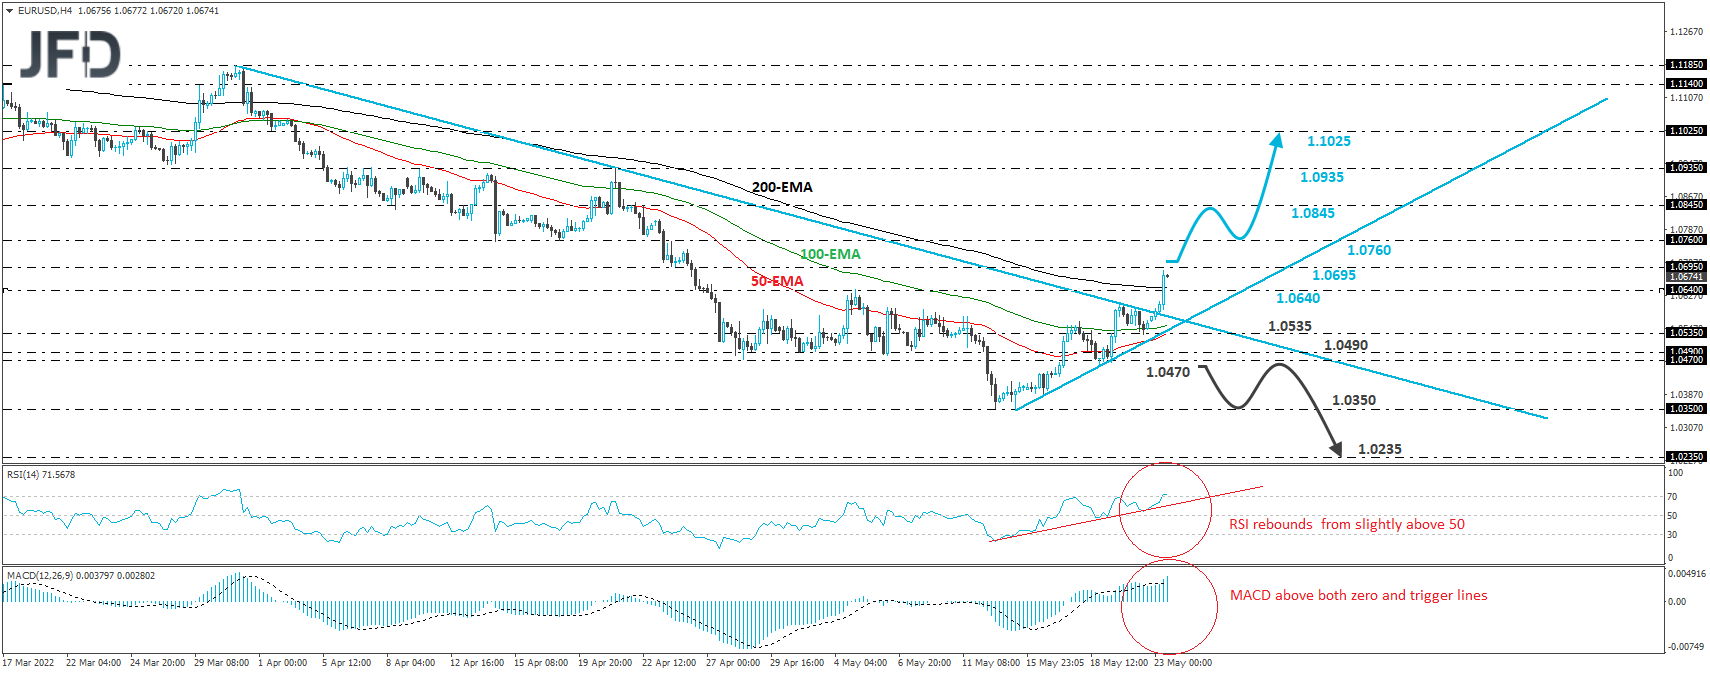
EUR/USD spiked higher on Monday, breaking above the downside resistance line drawn from the peak of March 31st. This, combined with the fact that the rate has been also respecting an upside support line drawn from the low of May 13th, suggests that the short-term outlook may have turned to somewhat positive for now.
At the time of writing, the rate is trading slightly below the 1.0695 barrier, marked by the inside swing low of April 25th, the break of which could aim for the key area of 1.0760, which is marked by the inside swing lows of April 14th and 19th. If the bulls are not willing to stop there, we may see them aiming for the 1.0845 zone, where another break could target the key obstacle of 1.0935, which acted as a temporary ceiling between April 6th and 21st. If they don’t abandon the action there either, then we may see them pushing towards the 1.1025 area, marked by the inside swing low of April 1st.
Shifting attention to our short-term oscillators, we see that the RSI moved higher and just crossed above 70, while the MACD lies above both its zero and trigger lines, pointing up as well. Both indicators detect strong upside speed and support the notion for further declines in this exchange rate.
On the downside, we would like to see a clear dip below 1.0470 before we reconsider the bearish case. Such a move would confirm the rate’s return back below both the aforementioned diagonal lines, and may initially target the 1.0350 zone, marked by the lows of May 12th and 15th, the break of which could carry larger bearish implications, perhaps setting the stage for a teste near the 1.0235 territory, marked by the inside swing high of July 2002.
Disclaimer:
The content we produce does not constitute investment advice or investment recommendation (should not be considered as such) and does not in any way constitute an invitation to acquire any financial instrument or product. The Group of Companies of JFD, its affiliates, agents, directors, officers or employees are not liable for any damages that may be caused by individual comments or statements by JFD analysts and assumes no liability with respect to the completeness and correctness of the content presented. The investor is solely responsible for the risk of his investment decisions. Accordingly, you should seek, if you consider appropriate, relevant independent professional advice on the investment considered. The analyses and comments presented do not include any consideration of your personal investment objectives, financial circumstances or needs. The content has not been prepared in accordance with the legal requirements for financial analyses and must therefore be viewed by the reader as marketing information. JFD prohibits the duplication or publication without explicit approval.
CFDs are complex instruments and come with a high risk of losing money rapidly due to leverage. 72.99% of retail investor accounts lose money when trading CFDs with the Company. You should consider whether you understand how CFDs work and whether you can afford to take the high risk of losing your money. Please read the full Risk Disclosure.
Copyright 2022 JFD Group Ltd.
WEEKLY FINANCIAL NEWSLETTER