Asian Indices:
- Australia’s ASX 200 index fell by -45.6 points (-0.63%) and currently trades at 7,151.00
- Japan’s Nikkei 225 index has fallen by -149.72 points (-0.45%) and currently trades at 33,092.87
- Hong Kong’s Hang Seng index has fallen by -134.81 points (-0.75%) and currently trades at 17,862.36
- China’s A50 Index has fallen by -46.88 points (-0.37%) and currently trades at 12,553.07
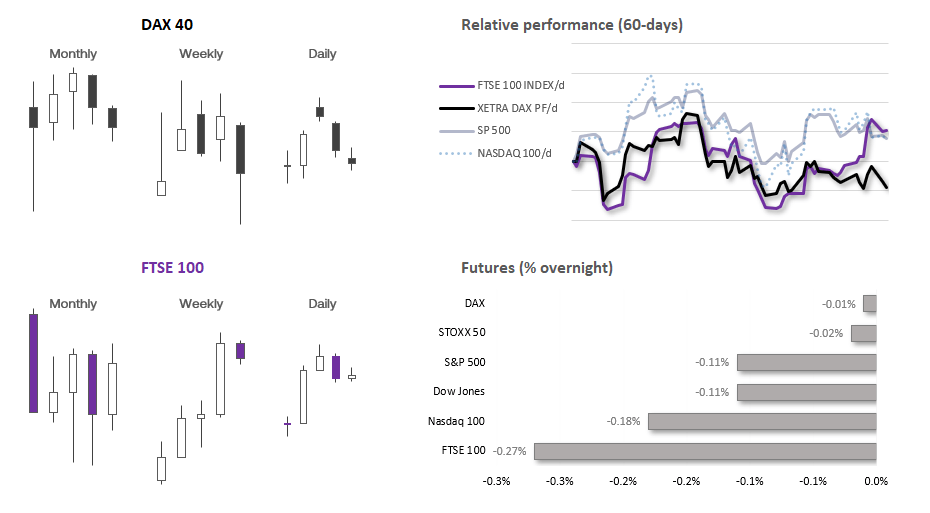
UK and Europe:
- UK’s FTSE 100 futures are currently down -21 points (-0.27%), the cash market is currently estimated to open at 7,639.20
- Euro STOXX 50 futures are currently down -1 points (-0.02%), the cash market is currently estimated to open at 4,241.70
- Germany’s DAX futures are currently down -1 points (-0.01%), the cash market is currently estimated to open at 15,663.48
US Futures:
- DJI futures are currently down -37 points (-0.11%)
- S&P 500 futures are currently down -4.75 points (-0.11%)
- Nasdaq 100 futures are currently down -27.5 points (-0.18%)
Events in focus (GMT+1):
- 16:00 – UK inflation
- 04:00 – FOMC meeting
- 04:30 – FOMC press conference
The People’s Bank of China (PBOC) kept their benchmark lending rates unchanged. Whilst this is in line with expectations, it could be taken as a sign that Beijing see early signs of the economy stabilising.
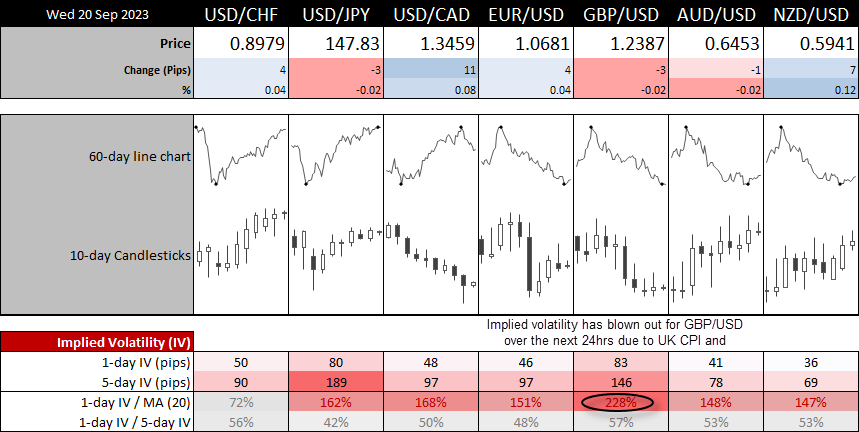
Implied volatility levels for the next 24 hours are elevated ahead of today’s FOMC meeting. In particular, GBP/USD IV is more than twice its 20-day average due to the UK inflation report up shortly. At 228% of its 20-day MA, it suggests a ~146 pip move on GBP/USD, while EUR/USD IV suggests a ~190 pip move.
UK inflation data is the first main event at 07:00 BST (16:00 Sydney), where another hot set of CPI figures could seal another hike from the Bank of England tomorrow. And given the British pound has underperformed of late, it could give GBP pairs a bit of a bounce before the FOMC meeting. If this were to be coupled with a surprisingly dovish FOMC meeting, we may even see GBP/USD lift itself up materially from its 3-month lows. Although at this stage I suspect bears may be looking to fade into minor rallies on GBP/USD to see if it can head for the 1.23 handle. Clearly, a refreshingly soft set of inflation figures could see GBP/USD break to a fresh 3-month low ahead of the FOMC meeting.
GBP/USD technical analysis (4-hour chart):
The British pound remains within an established downtrend on the 4-hour chart, although a bullish RSI divergence is forming on the RSI (14). Still, with volatile event spending, GBP/USD has the potential to move aggressively in either direction. The 1-day implied volatility level is relatively large to the weekly range.
Given its close proximity to the cycle lows, bears may want to see if prices can revert higher and form a swing high to suggest momentum is set to return to its downtrend at a higher price (to increase the potential reward to risk ratio. If UK inflation surprise to the downside, perhaps we’ll see a break to a new cycle low and head towards 1.23.

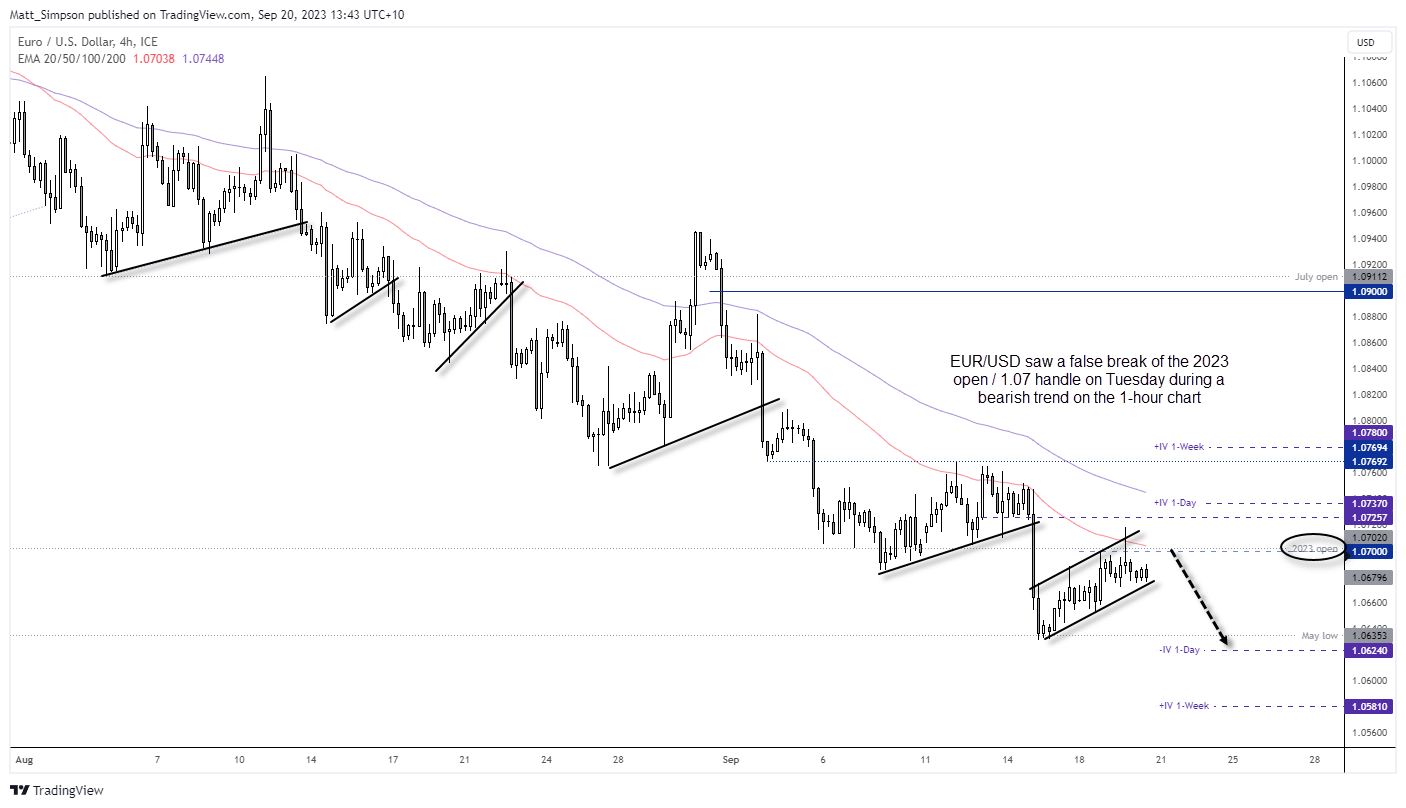
EUR/USD technical analysis (1-hour chart):
I have outlined my bearish bias in recent articles and I retain that view today. But in a nutshell. I suspect the Fed will be more hawkish than expected, the ECB are done tightening, futures traders are increasing shorts against the euro whilst culling longs and the USD is on the cusp of reaching net-long exposure against G10 currencies.
I noted in Wednesday’s Asian Open report that EUR/USD had rallied straight into the 61.8% Fibonacci level before reversing and closing the day back beneath 1.07. However, what makes the ‘fakeout’ particularly interesting is that this sits around the 2023 open price, which means the EUR/USD has effectively gone nowhere this year and traders are clearly watching this level.
Yesterday’s bearish hammer may have even marked a high, but any moves towards the 1.0700 area ahead of the meeting may interest bearish swing traders. Ultimately, my bias remains bearish beneath 1.0730 and for a move back towards 1.064 May lows initially, and eventually beyond on route towards 1.0500.
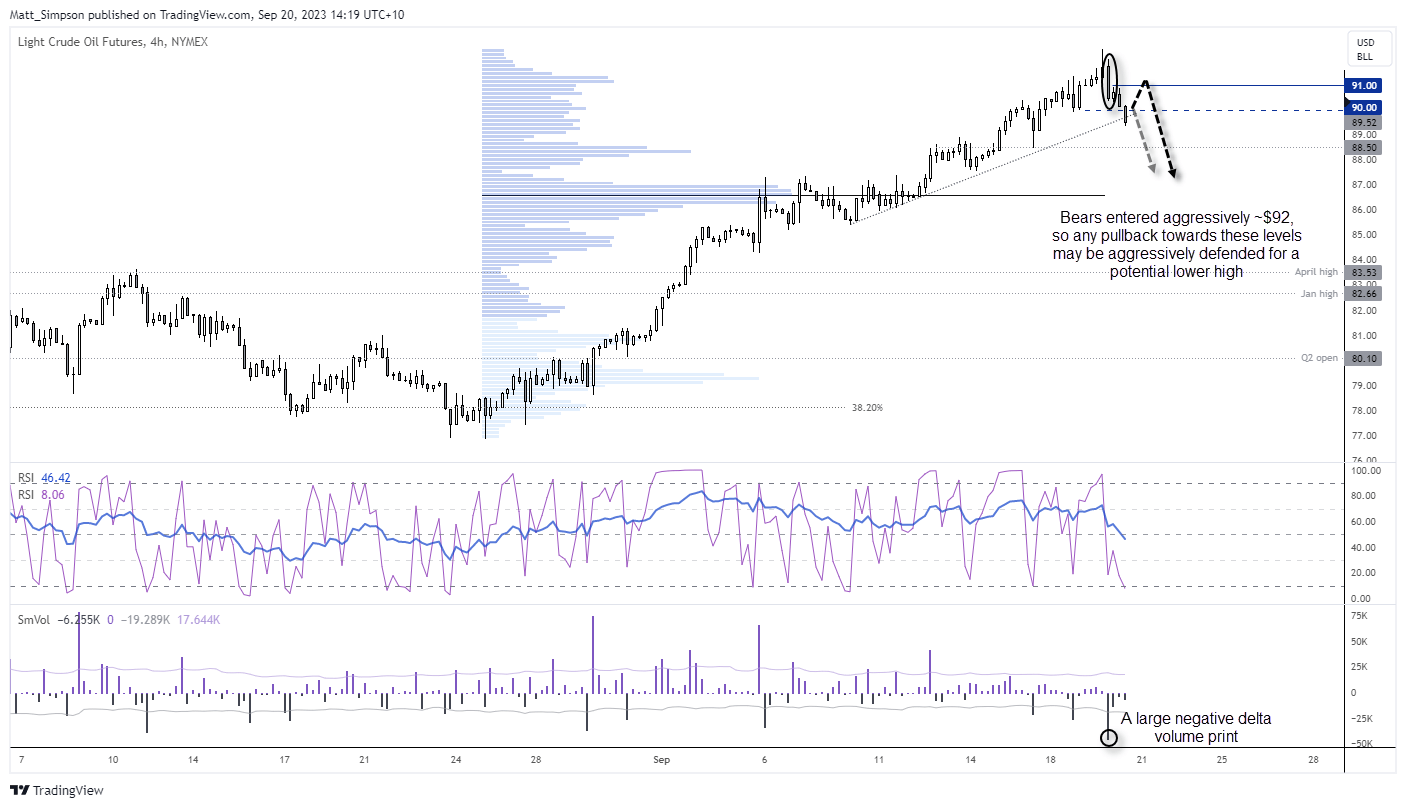
WTI crude oil technical analysis (4-hour chart):
I noted earlier in today’s Asian session that a potential key reversal day formed on WTI, which leaves the potential for a pullback against its strong, bullish trend. Of course, a hawkish FOMC meeting could help it move lower sooner, but its 45% rally since the June low suggests we’re probably closer to a retracement than not.
Prices have since broken beneath Tuesday’s low and the $90, and now probing trend support on the 4-hour chart. I’m always a bit suspicious of breakouts in the Asian session, especially when it is ahead of an important event like the FOMC meeting.
I therefore wouldn’t be too surprised to see prices pop back higher above $90 before the real move lower begins. We can see that Volume delta was very negative during the selloff from $92, and those bears are presumably still short. Subsequent volumes have been relatively low, hence the hunch of a pullback in the European session. Ultimately, any move towards the $94 area could be of interest for bearish swing traders to seek its next leg lower (and hopefully a true break of the trendline).