EUR/USD has fallen for nine consecutive weeks, a bearish sequence not exceeded since 1997. An initial assumption is that EUR/USD may be due for a bounce higher, but historical data shows that long bearish sequences can occur in the midst of downtrends. For example, in 2014, EUR/USD fell for eight consecutive weeks before continuing to fall by over 18% in the following months. This is likely due to the fact that strong macro forces can make technical analysis assumptions such as ‘oversold’ less reliable.

FOMC meeting to be a key driver for EUR/USD
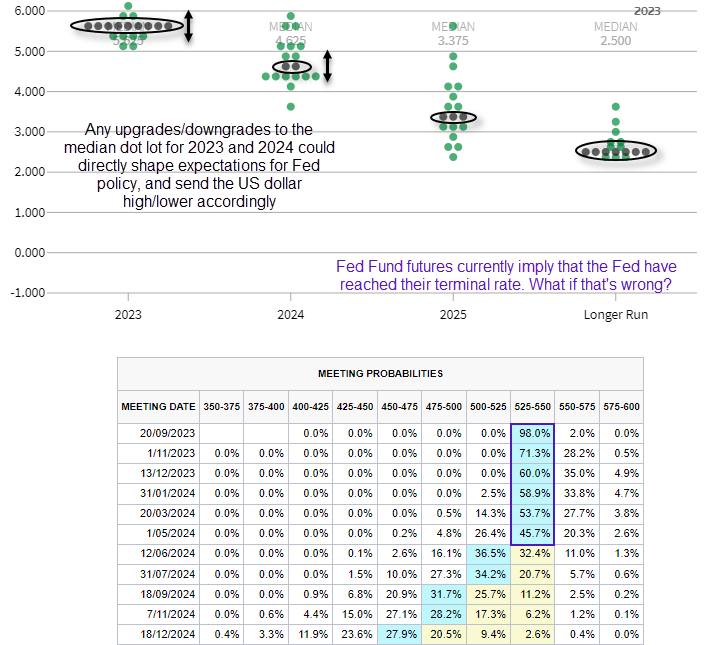
We also have an important FOMC meeting to content with, which is likely to be a volatile event and has the ability to make or break trends across global markets. With Fed Fund futures applying a 98% chance that the Fed will hold rates steady, it is practically a given they will. Yet with economic data from the US remaining strong (and therefore inflationary) alongside rising commodity prices, are the Fed Fund futures correct in implying a terminal rate at the current level of 5.25-5.5%?
If the meeting is more hawkish than expected, this could quickly see markets price in another hike in their November or December meeting and send yields and the US dollar higher, and weigh on EUR/USD.

Of course, if the Fed were to surprise markets with a dovish hold it could spark a strong risk-on rally and send indices and gold lower but support commodity currencies such as AUD, CAD and NZD. We’d also expect EUR/USD to trade higher, at least initially. But with the ECB effectively confirming they have reached their terminal rate as incoming data points to a recession, strength on EUR/USD may be ‘short’ lived. I am therefore inclined to suspect this week’s FOMC meeting will have a hawkish twist, if any surprise is delivered.
Key metrics to watch are for any revisions for inflation and the Dot plot. In particular, the median dot plot would need to be lower for 2023 and 2024 to stand any chance of a dovish reaction (weaker USD).
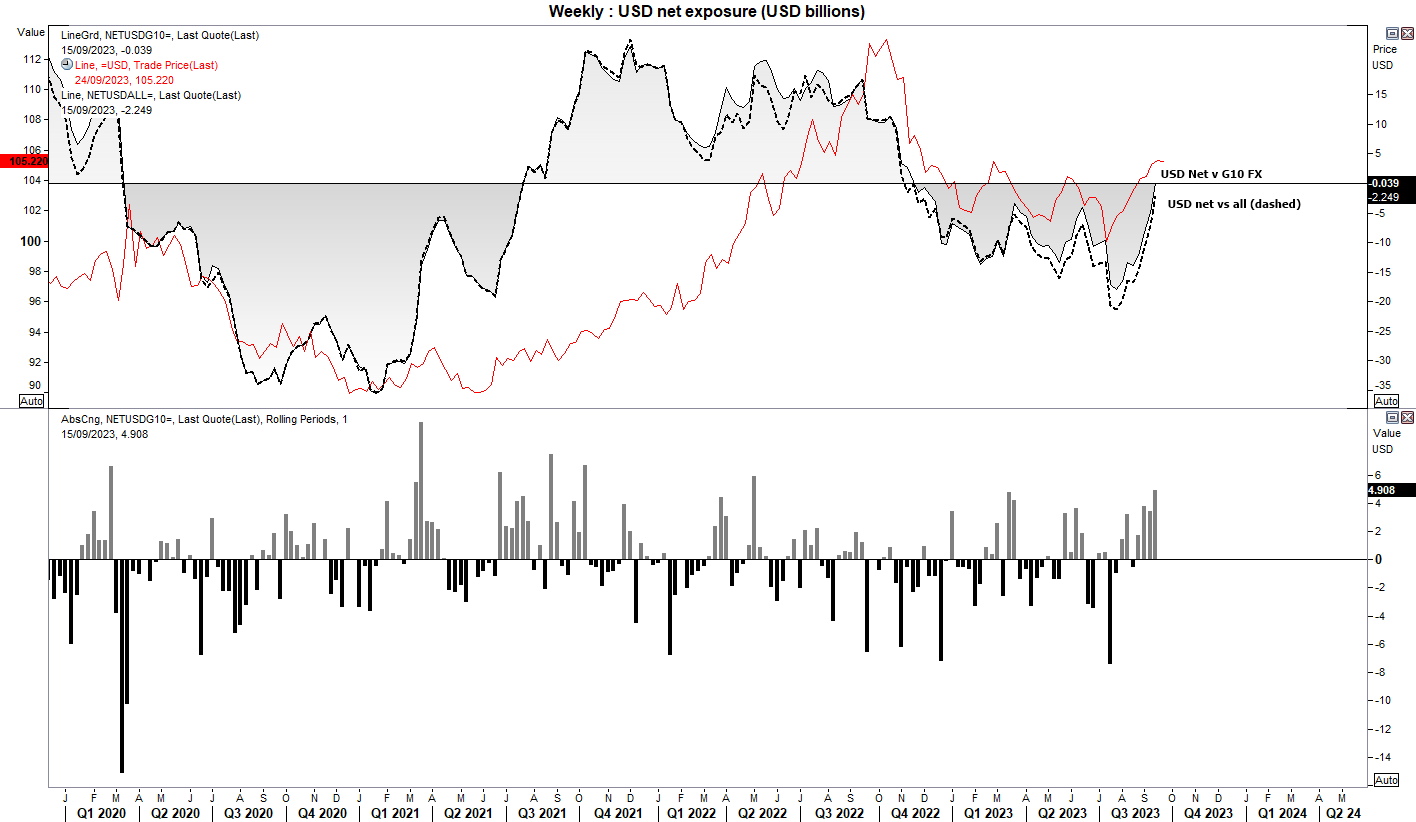
The USD is on the cusp of flipping to net-long exposure against G10 currencies
Something else to consider is the broad-based strength of the US dollar and repositioning on EUR/USD futures. According to data complied by the International Monetary Market (IMM), traders are on the cusp of being net-long USD against G10 currencies. A quick look at the chart shows that long or short exposure can last for over a year which is switches between them.

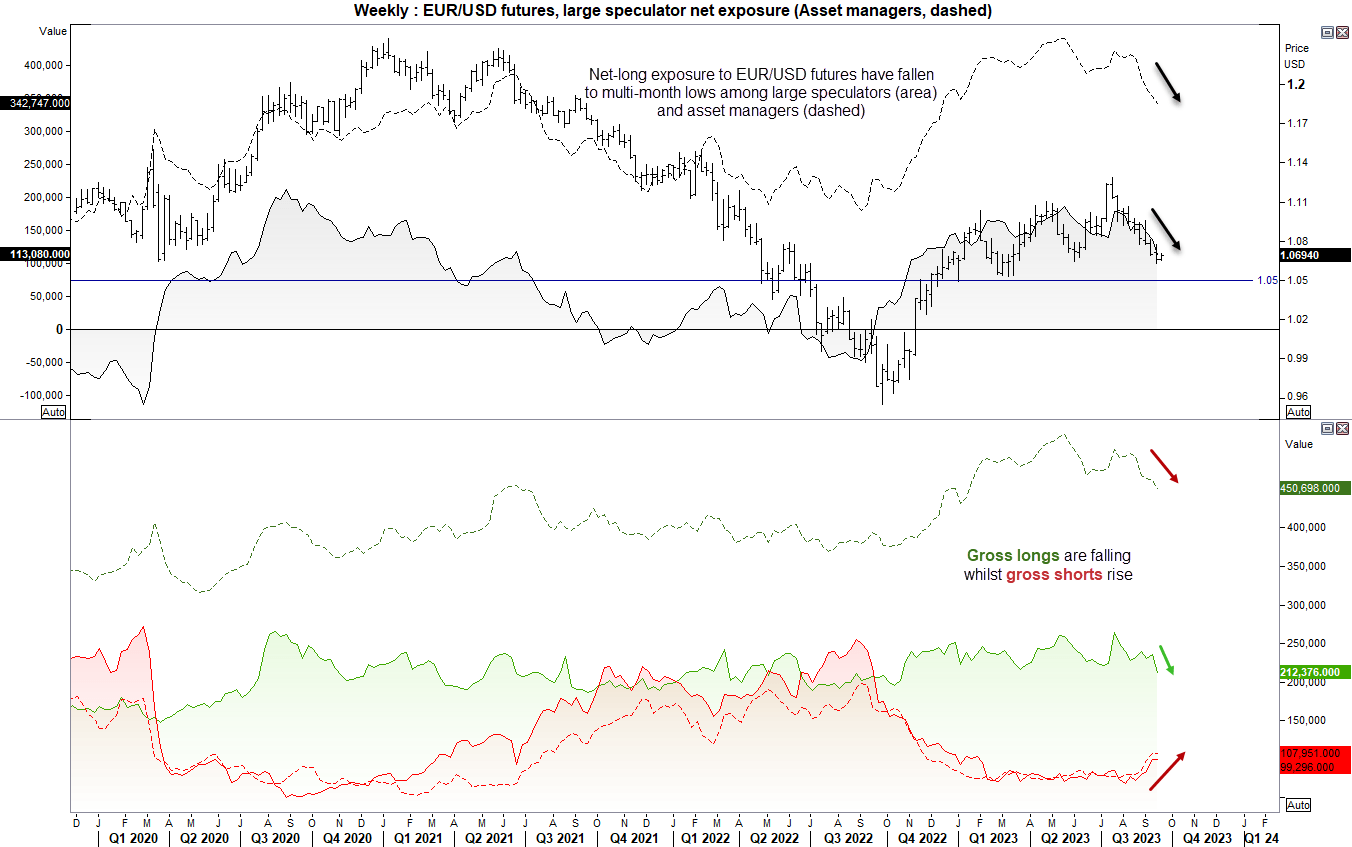
Furthermore, net-long exposure on EUR/USD futures are finally falling after spending a long time at historically high levels. Both large speculators and asset managers are increasing their short exposure whilst decreasing their short exposure which is dragging net-long exposure lower. And that is the classic combination we’d expect to see for a strong trend (in this case, lower for EUR/USD).

EUR/USD technical analysis (daily chart)
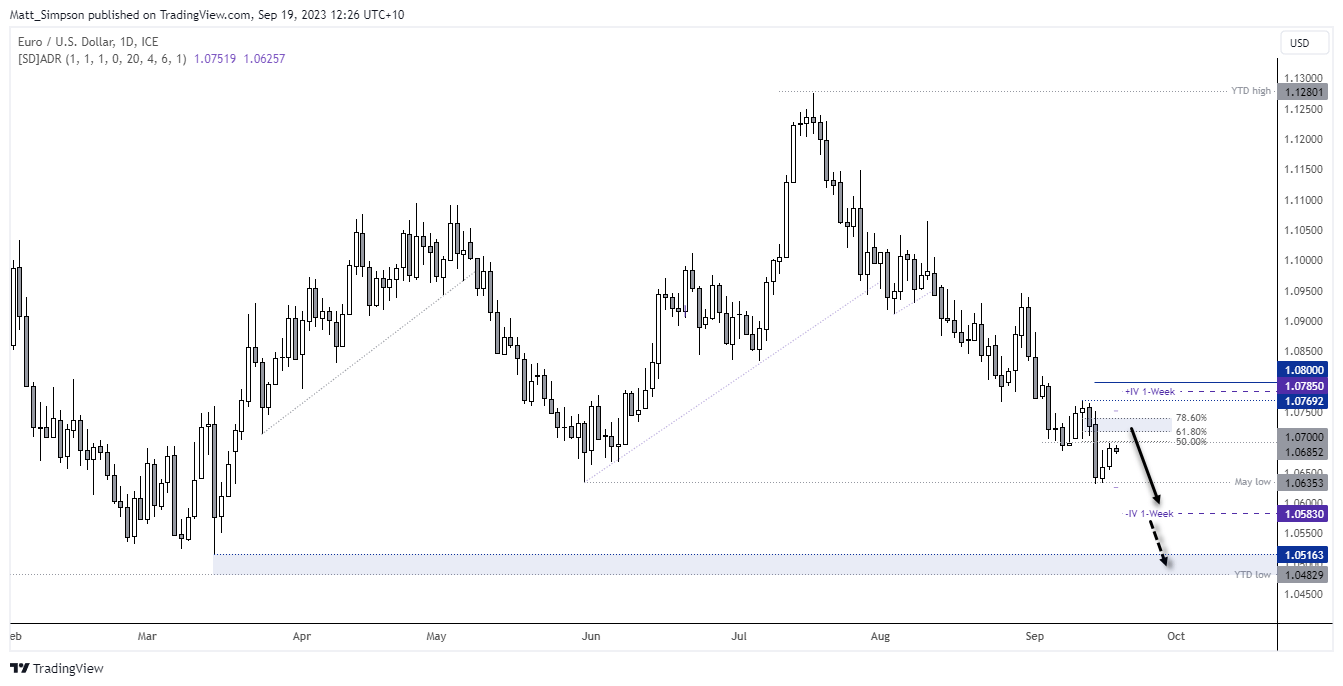
EUR/USD trades within a clear downtrend on the daily chart, although it found support around the May low and has retraced higher for the past two days. Given I see the risks of a stronger US dollar beyond the FOMC meeting and coming weeks, low volatility moves higher may be appealing for bears wanting to fade into the move.
- Yesterday’s high stalled around a 50% retracement level, although the 61.8% Fibonacci level at 1.0718 or 78.6% level at 1.0744 could also act as areas for bears to consider fading into
- The bias remains bearish beneath the 1.0770 high (or 1.0800 for more conservative risk management)
- Initial target is the 1.0516 low, near the 1.05 handle and YTD low of 1.0483
- Bears with a longer outlook may also want to consider a break of the YTD low with an open downside target
