EUR/USD Technical Analysis Summary
Buy Stop: Above 1.1478
Stop Loss: Below 1.1435
| Indicator | Signal |
|---|---|
| RSI | Sell |
| MACD | Sell |
| Donchian Channel | Neutral |
| MA(200) | Buy |
| Fractals | Buy |
| Parabolic SAR | Buy |
EUR/USD Chart Analysis
EUR/USD Technical Analysis
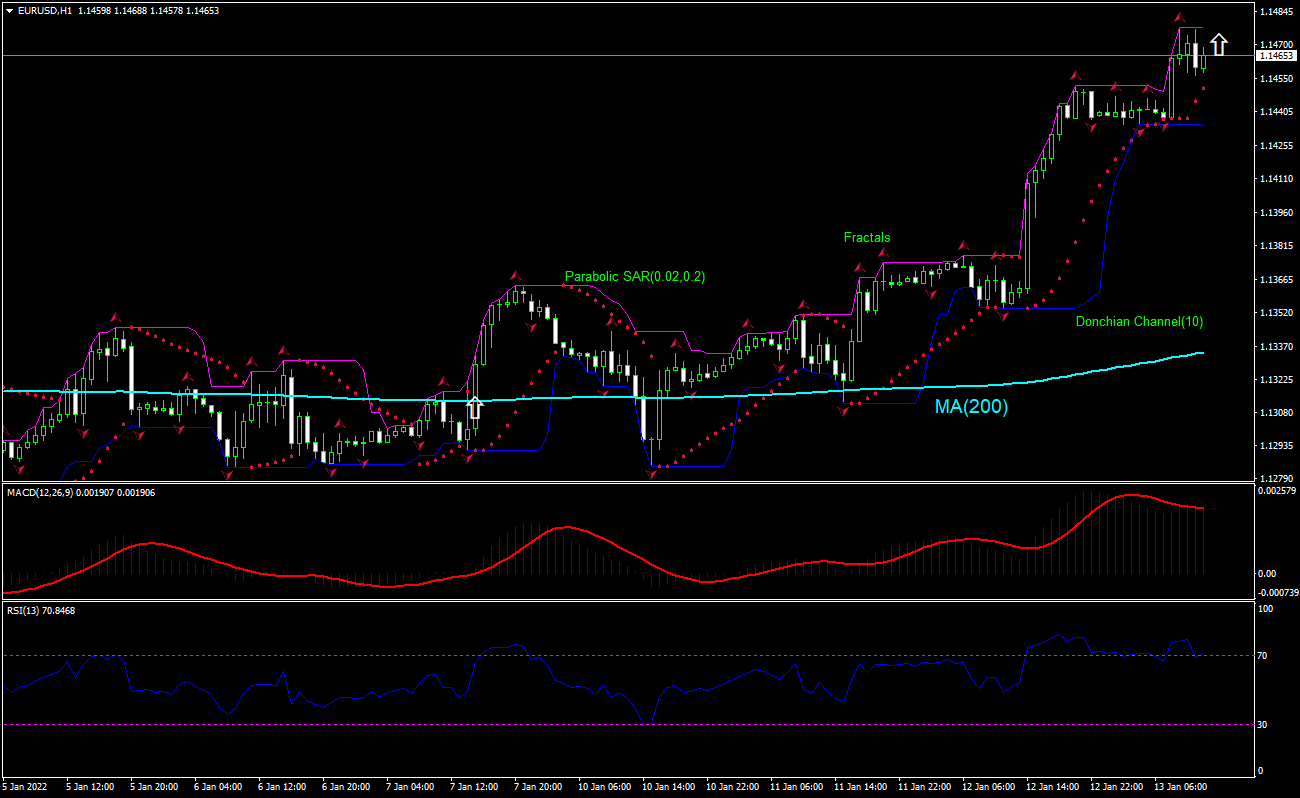
The EURUSD technical analysis of the price chart on 1-hour timeframe shows EURUSD: H1 is rising above the 200-period moving average MA(200) which is tilted upward. We believe the bullish movement will continue after the price breaches above the upper bound of the Donchian channel at 1.1478. A level above this can be used as an entry point for placing a pending order to buy. The stop loss can be placed below 1.1435. After placing the order, the stop loss is to be moved to the next fractal low indicator, following Parabolic signals. Thus, we are changing the expected profit/loss ratio to the breakeven point. If the price meets the stop loss level without reaching the order, we recommend cancelling the order: the market has undergone internal changes which were not taken into account.
Fundamental Analysis of Forex - EUR/USD
Euro zone’s industrial output recovered in November. Will the EURUSD price rebound continue?
Euro zone’s industrial output recovered in November: the statistics office Eurostat reported euro area industrial production rose 2.3% over month in November after 1.3% decline in October. This is bullish for EURUSD.