Nvidia Technical Analysis - Nvidia Trading: 2022-02-17
Nvidia Technical Analysis Summary
Buy Stop։ Above 268.98
Stop Loss: Below 236.21
| Indicator | Signal |
|---|---|
| RSI | Neutral |
| MACD | Buy |
| Donchian Channel | Neutral |
| MA(200) | Sell |
| Fractals | Buy |
| Parabolic SAR | Buy |
Nvidia Chart Analysis
Nvidia Technical Analysis
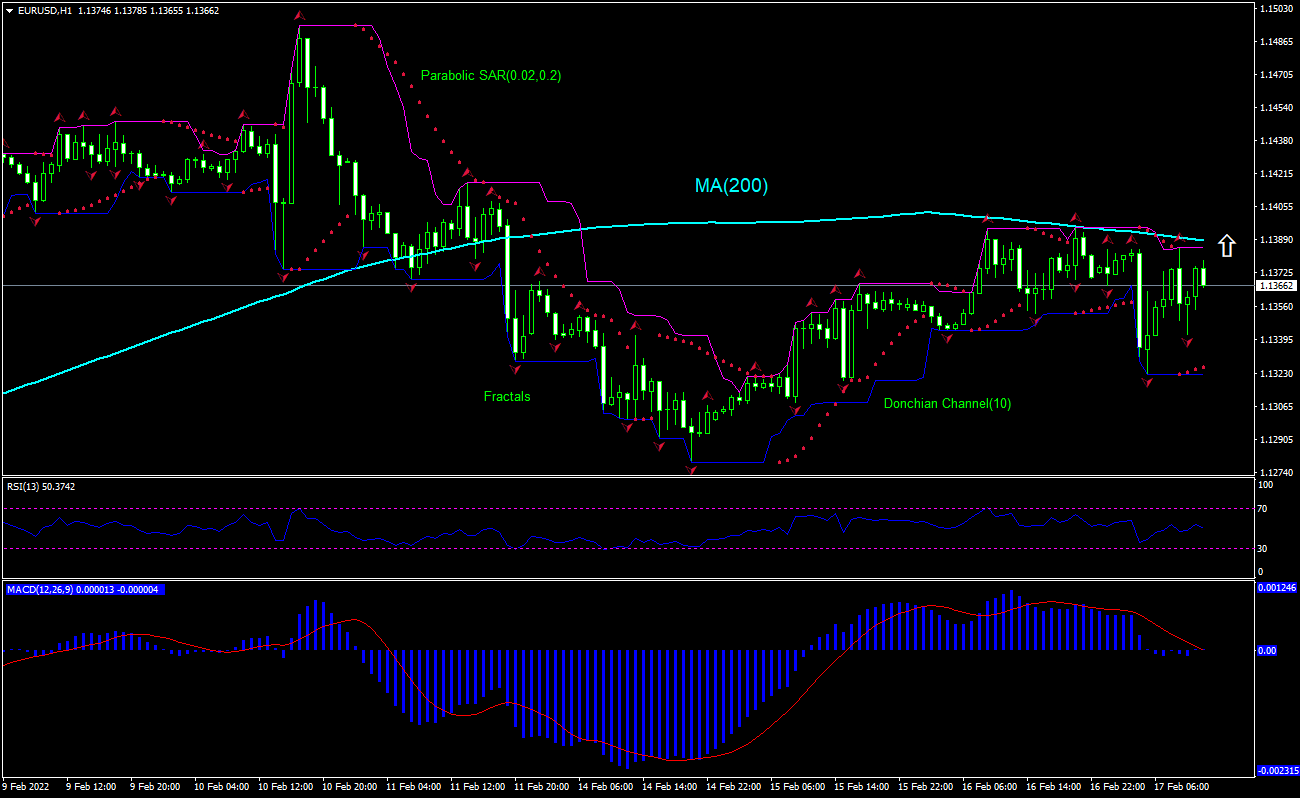
The technical analysis of the Nvidia stock price chart on daily timeframe shows #S-NVDA, Daily has breached above the resistance line after testing the 200-day moving average MA(200) which is tilted up. We believe the bullish momentum will resume after the price breaches above the upper boundary of Donchian channel at 268.98. This level can be used as an entry point for placing a pending order to buy. The stop loss can be placed below the lower boundary of Donchian channel at 236.21. After placing the order, the stop loss is to be moved every day to the next fractal low, following Parabolic indicator signals. Thus, we are changing the expected profit/loss ratio to the breakeven point. If the price meets the stop loss level (236.21) without reaching the order (268.98), we recommend cancelling the order: the market has undergone internal changes which were not taken into account.
Fundamental Analysis of Stocks - Nvidia
Nvidia stock price retreated in after-hour trading yesterday despite the chip maker forecast next quarter revenue above analysts’ estimates. Will the Nvidia stock price rebound persist?
Nvidia reported yesterday fourth quarter revenue of $7.64 billion, a record, versus forecasts of $7.42 billion. Its earnings rose to about $3 billion in the fourth quarter from $2.46 billion a year earlier. Data center revenue grew 71% to a record $3.26 billion in the fourth quarter that ended January 30. Gaming revenue rose 37% from a year ago to a record $3.42 billion. As to next quarter guidance, Nvidia expects first quarter revenue of about $8.1 billion, compared with analysts’ estimates of $7.29 billion, according to IBES data from Refinitiv. These improved data are clearly bullish for Nvidia stock price. However, the gross margin remained unchanged from the previous quarter at 67.0%. And shares lost 2.8% in after-hours trading as investors deemed Nvidia’s exposure to the volatile crypto market a downside risk: sales of crypto-mining cards account for a significant part of Nvidia’s gaming sales. Nvidia stock’s P/E ratio (Trailing Twelve Months) has decreased from 92.51 in the beginning of January to 74.78 currently, making it less costly for purchase. Indicators are generating more buy signals compared to few neutral signals. The MACD (moving average convergence divergence) index has generated a buy signal. While the MACD-Histogram is in negative territory the upward sloping trajectory is pointing to higher prices. The RSI index gives a neutral signal: it is flat near the centerline 50 value. Bill Williams Fractals indicator gives a buy signal: it confirms an upward trend is in progress. The Parabolic SAR indicator gives a neutral signal: dots are below the price after moving from above the price to below the price. And the stock price has breached above the resistance line as it is rebounding after testing the 200-day moving average MA(200).